


Reorder Point Calculator
A reorder point calculator is the math that tells you when to buy more stock.
Reviewed November 2026.
Each item gets one number. When on-hand units drop to it, you place an order.
You need no special software. A spreadsheet or an accounting package can run the math.
Distributors, warehouses and fulfillment centers use it to prevent stockouts.
A stockout is a day with no units left to sell.
Every example uses numbers you can check with a calculator.
Read on for the formula, where each input comes from, and the mistakes that cause empty shelves.
Book a call
What Is a Reorder Point Calculator?
A reorder point calculator is a short routine that finds the stock level for placing a new order. It answers one question: when do I buy more?
The word calculator here means the math. You can do it on paper, in a spreadsheet or inside an accounting package.
Distributors, warehouses and fulfillment centers run it for every item they restock. A team with 300 items needs 300 numbers.
Set once and checked often, those numbers replace guesswork on the shelf.
What Is a Reorder Point?
A reorder point is the stock level that triggers a new buy order. You set it so new stock arrives just as you run low.
Set it too high and cash sits on shelves. Set it too low and stockouts follow.
Counting stock is also a legal duty. IRS Publication 538 says "you must value your inventory at the beginning and end of each tax year."
A good reorder point protects both your cash and your customers.
We build it for your operation, and the first look is free
If you would rather not compare products, describe how your operation already works and we build the system around it.
No build cost. You see it running on your own process first, and the monthly subscription starts only once it is live.
Book a callWhat Is the Reorder Point Formula?
The reorder point formula is average daily usage times lead time in days, plus safety stock. Here is the formula in one line:
Reorder point = (average daily usage x lead time in days) + safety stock
Each part has a plain meaning:
- Average daily usage is the number of units you sell or ship on a normal day. Pull it from your shipping records.
- Lead time is the number of days from placing an order to having stock ready to sell. Count the whole trip.
- Safety stock is the extra cushion you hold for busy days and late trucks. It sits inside the reorder point.
Three inputs give you one number, and you already hold the data for all three.
How to Find Your Average Daily Usage
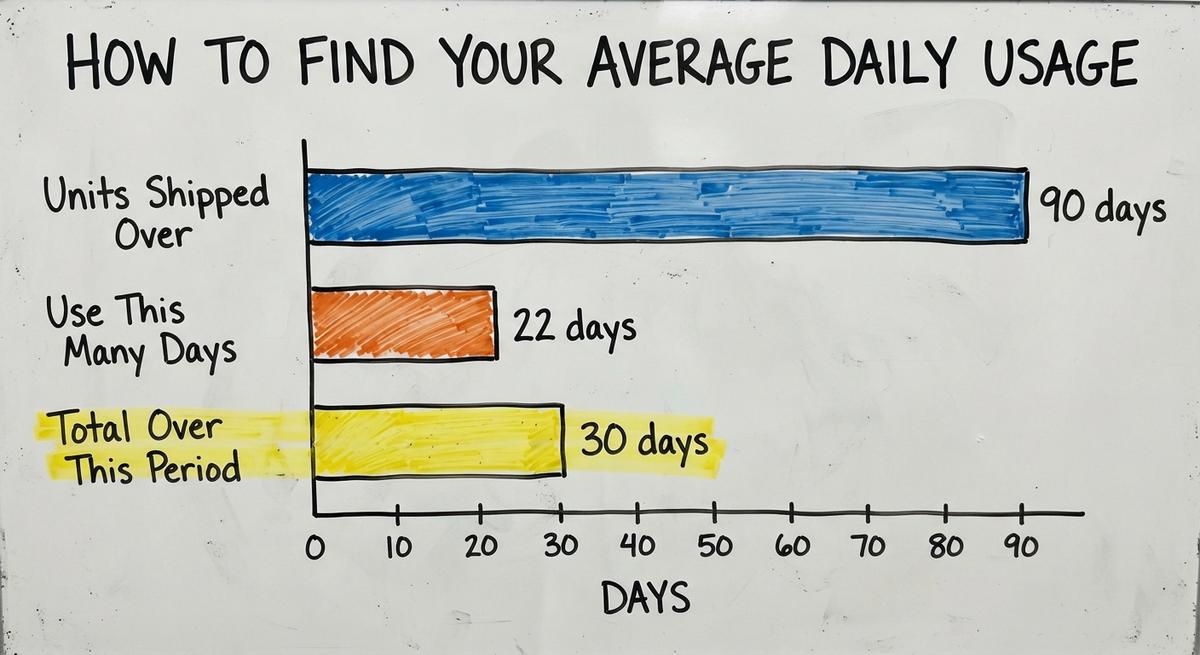
Average daily usage is total units used over a period, divided by the days in that period. Follow these steps for each item:
- Pull units shipped over 30, 60 or 90 days. Use your accounting software's inventory reports or your sales records.
- Divide the total by the number of days. A total of 1,200 units over 30 days is 40 a day.
- Count only the days you were open if you ship Monday to Friday. Use 22 days, not 30.
- Use shipped units rather than orders placed when you can. Backorders skew order counts.
A longer window smooths out noise. A shorter window tracks a fast change. Pick one window and use it for every item.
Shipped units over open days give the truest daily number for your reorder point.
How to Measure Lead Time
Lead time is the number of days from placing an order to having the stock on the shelf, ready to sell. Count the whole trip, not just the truck ride.

A reorder point built on a short lead time fires too late. The shelf empties before the truck arrives.
What Counts in Lead Time
Lead time has three parts. Add them all:
- Supplier processing is the time the supplier takes to pick, pack and release your order. Ask for the real figure.
- Shipping is the time the goods spend in transit to your dock. Add any wait for a carrier pickup.
- Receiving and put-away is the time to check, count and shelve the goods. Stock cannot sell until this step ends.
Each part belongs in the reorder point math, so none of them can be skipped.
Which Number to Use
The best number is the real average from your last 10 orders, not the supplier's promise. Quoted lead times describe the best case.
Your receiving records show what happens at your dock. Write down the slowest delivery too. That worst case shows how far a late shipment can stretch.
The slowest delivery feeds the safety stock math below.
Real delivery dates beat quoted ones every time.
What Is Safety Stock?
Safety stock is extra inventory that covers surprises, such as a demand spike or a late shipment.
You pay to hold it. You also pay when a sale is lost. Safety stock balances those two costs.
Different items need different cushions. A fast mover from a slow supplier needs more than a steady item from a nearby one.
People mix up reorder point vs safety stock. The reorder point is the full trigger. Safety stock is one part inside it.
Safety stock is the cushion, and the reorder point is the cushion plus expected demand.

How to Calculate Safety Stock
Safety stock is the gap between your worst case and your normal case. Use this simple method:
Safety stock = (max daily usage x max lead time) - (average daily usage x average lead time)
The first part is the most you would need if the slowest delivery met the busiest sales. The second part is what you expect on a normal run. The gap is your cushion.
Statistical methods exist. They measure how much demand swings from day to day. The simple method is a good start for any reorder point.
Worst case minus normal case gives a cushion you can defend.
Not sure this is the right shape for your operation
Describe how the work runs today. We map it on a call and show you what it would look like built around that, before you spend anything.
Book a callReorder Point Example With Real Numbers
A distributor that sells 40 cases a day with a 7 day lead time gets a reorder point of 550 cases. All numbers here are illustrative.
The Inputs
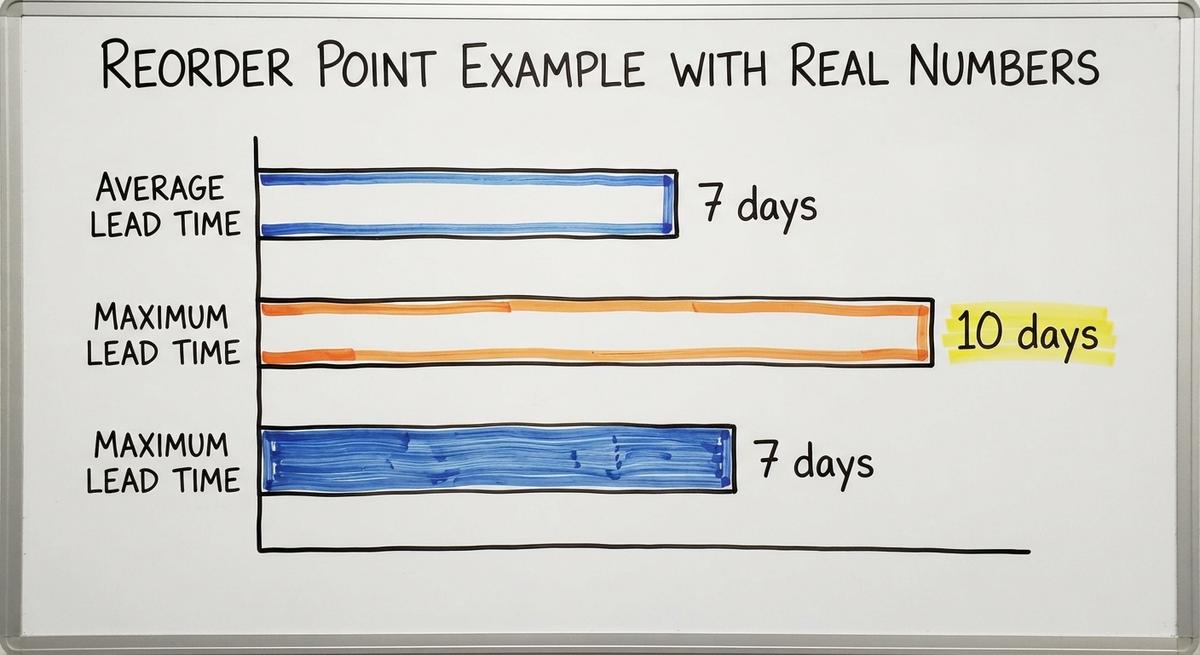
The reorder point calculation needs four inputs. They are average and maximum daily usage, and average and maximum lead time. Every result below traces back to them.
- Average daily usage is 40 cases. Average lead time is 7 days.
- Max daily usage is 55 cases. Max lead time is 10 days.
The Math
The math turns four inputs into a safety stock and a reorder point. Work it in four steps:
- Worst case: 55 x 10 gives 550 cases.
- Normal case: 40 x 7 gives 280 cases.
- Safety stock: 550 - 280 gives 270 cases.
- Reorder point: 280 + 270 gives 550 cases.
The reorder point lands on the worst case. When on-hand stock falls to 550 cases, the distributor places the order.
A Second Item for Contrast
A slow item with 4 units a day and a 5 day lead time needs far less. Say max usage is 6 units and max lead time is 7 days. The numbers are illustrative.
- Worst case: 6 x 7 gives 42 units.
- Normal case: 4 x 5 gives 20 units.
- Safety stock: 42 - 20 gives 22 units.
- Reorder point: 20 + 22 gives 42 units.
The same formula gives 550 for one item and 42 for the other. One method fits both.
What Is the Difference Between Reorder Point and Reorder Quantity?
Reorder point says when to order. Reorder quantity says how many units to buy.
Economic order quantity, or EOQ, is a formula that finds the order size with the lowest total cost of ordering and holding. Suppliers also set minimum order sizes, such as a full pallet. Those minimums can override the math.
You need both numbers. One without the other leaves a gap in the buying rule.
Take the 550 case example. The point says to order at 550 cases. The quantity says whether to buy 500 or 1,000.
A full restocking rule needs a trigger and a size.

Reorder Point vs. Par Level and Minimum Stock
A par level is the stock amount you want on hand after each restock. A min/max rule sets a floor and a ceiling. When stock hits the min, you order up to the max.
A reorder point comes from usage and lead time. A min level is a guess in many shops.
A simple min/max rule is good enough for cheap, steady items, such as packing tape or labels. Late delivery of those items costs little.
Use the full formula where a stockout costs real sales.
How to Set Reorder Points for Seasonal Items
Say a patio item sells 10 a day in winter and 45 a day in summer. A yearly average near 28 a day fits neither season. You run dry in July and overstock in January.
Seasonal items need reorder points built from usage in the same season last year, not a flat yearly average.
Try this plan for each seasonal item:
- Raise reorder points 1 lead time before the peak starts. Stock must land before the rush.
- Lower them once sales fall back. Extra units tie up cash for months.
- Put review dates on the calendar for each season change. Name one owner for each date.
Take the patio item with a 7 day lead time. Summer usage of 45 a day gives a normal case of 315 units before any cushion. Winter usage of 10 a day gives only 70. The numbers are illustrative.
A reorder point that follows the season follows the demand.
The comparison is easier when one option is built for you
Off-the-shelf means fitting your process to the software. We do it the other way round, and the first look costs nothing.
Book a callHow to Handle Items With Several Suppliers
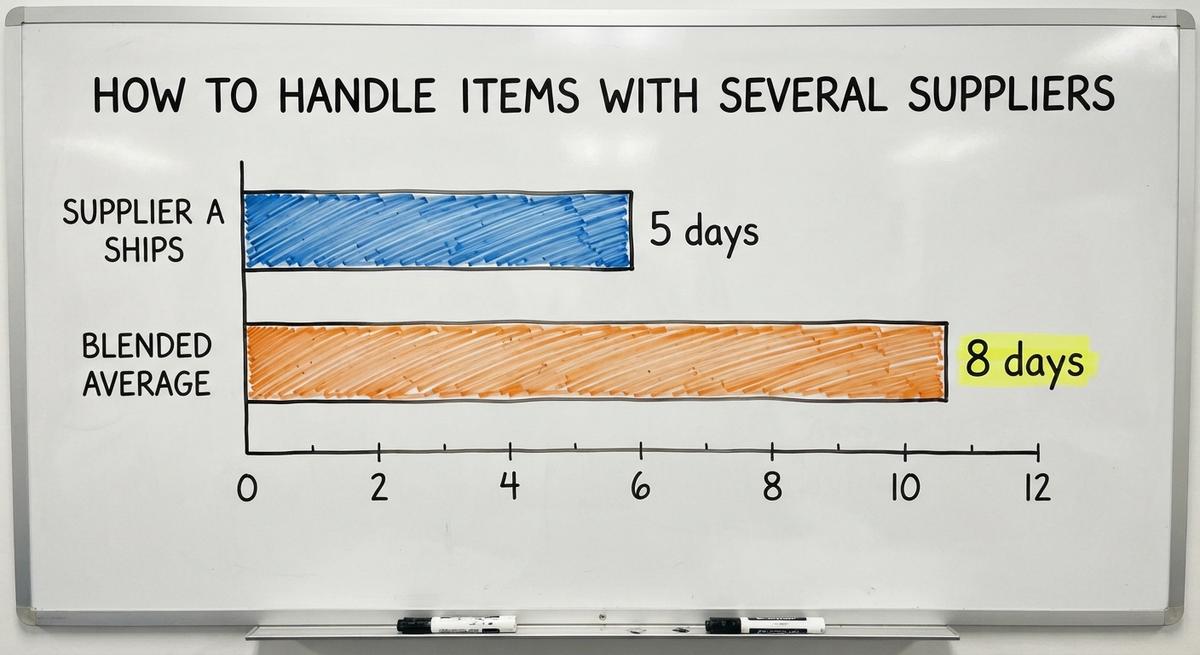
An item with 2 suppliers has 2 lead times. Use the lead time of the supplier you order from most.
For key items, set a reorder point for each supplier. Then you know the trigger for each route.
Mixing lead times costs money. Say supplier A ships in 5 days and supplier B in 12. A blended average of 8 days hides the risk. Orders from B arrive late, and the cushion is too thin.
Run the numbers at 40 units a day. Supplier A needs 200 units before any cushion. Supplier B needs 480. The blend of 320 serves neither one. The figures are illustrative.
One item with 2 lead times needs 2 honest numbers.

Which Items Need the Most Attention?
ABC analysis is a way to rank items by the money they bring in. It tells you where to spend your time on each reorder point.
- A items are your top revenue earners. Check their numbers most often, and review them every month.
- B items sit in the middle. Review them on a steady schedule, such as once a quarter.
- C items are low value. A simple min/max rule is enough for them.
Start with your top 20 items before you touch the whole catalog. Spend less effort on slow movers.
Twenty well-tuned items protect more revenue than 2,000 guessed ones.
Setting Up a Reorder Point Calculator in a Spreadsheet
A spreadsheet reorder point calculator needs 6 columns and 1 flag. You can build it in one sitting. Make these columns:
- Item holds the name or code. Keep one row for each item.
- Average daily usage holds units per day. Update it on your review dates.
- Lead time holds average days to the shelf. Use your own receiving records.
- Safety stock holds the cushion from the simple method. Compute it from the worst case.
- Reorder point holds usage times lead time, plus safety stock. Use a formula, not a typed number.
- On-hand holds the current count. Update it after each receipt and shipment.
Add a flag column. Use a formula that reads "ORDER" when on-hand is at or below the reorder point. Color those rows red.
Buy order tools store the reorder point on each item record. One enterprise purchasing guide shows how the order run reads that field. It defines the field as "ROP: Reorder point, taken from the ROP in the branch inventory record of the primary storage location (assuming that the ROP is not missing); or the ROP as calculated." Your sheet works the same way.
One red flag column turns a pile of numbers into a buying list.
What Are the Most Common Reorder Point Mistakes?
The most common mistake is using old usage data. Five errors cause most stockouts:
- Old data hides the fact that sales moved. Refresh usage on a schedule to keep the number honest.
- Ignored lead time changes leave you short when a supplier slows down. Log every late delivery.
- Stock on order must count. Compare the reorder point to on-hand plus on-order, minus units promised to customers.
- One cushion for every item wastes cash on steady items. It also starves volatile ones.
- No review lets every number drift. Drift is slow, so no one notices it.
Here is the stock position check in numbers. Say on-hand is 300 units and 400 are on order. Customers have claimed 50. The position is 300 + 400 - 50, or 650 units. The figures are illustrative.
Most of these errors are habits, so a calendar fixes them.
See it running on your own process first
No build cost. The subscription starts once it is live and doing the job, not before.
Book a callWhy Spreadsheet Reorder Points Go Stale
Time adds up. Say 2 people spend 5 hours a week on stock checks at $20 an hour. That is $10,400 a year. The US Bureau of Labor Statistics lists pay for inventory clerks, so check your own rate.

Spreadsheet reorder points go stale when someone types the numbers once and never updates them. Sales change every week. The sheet does not.
Data also sits in many places. Counts live in an accounting package, a spreadsheet, printed sheets and email threads.
The Census Bureau publishes wholesale inventories against sales each month. Your own ratio deserves the same watch.
Watch for these signs:
- Surprise stockouts on items that looked safe. The old number no longer matched demand.
- Rush orders with extra freight cost. Late triggers force costly shipping.
- Overstock on items that stopped selling. Cash sits idle on the shelf.
Three repeat signs mean the manual routine is slipping.
When to Automate Reorder Alerts
Automated reorder alerts make sense once the count of items, sites or stockouts outgrows a weekly manual check. Watch for these triggers:
- Hundreds of SKUs. A SKU is one distinct item you stock. One person cannot tune them all by hand.
- Several locations. Each site needs its own usage and its own reorder point.
- Frequent stockouts. Repeat misses show the numbers no longer match demand.
Questions to Ask Any Provider
A good provider can answer three plain questions about your reorder point setup. Put these questions to any provider before you sign:
- Accounting link: Can the tool keep your current accounting system in place? You should not have to move.
- Real sales data: Will it read your actual sales? A copy you retype goes stale fast.
- Right person: Can it alert the buyer who owns that item? Alerts that reach no one do nothing.
Avoid forced migrations and long builds. NIST offers vendor-neutral guidance on supply chain process.
Start With Alerts
An alert fires when stock reaches the reorder point. A person then checks the timing and quantity. The check costs nothing if the math is off.
Alerts can come before automatic buy orders. Prove the numbers first.
Good alerts let you trust the math before you let a machine spend money.
How Often Should You Review Reorder Points?
Review fast movers every month and slow movers every quarter. A fast mover shifts quickly, so its numbers age quickly.
Review any item right after a supplier change or a price change. Review also after a big customer win or loss.
Use this short routine for each review:
- Pull the latest 30, 60 or 90 days of shipped units.
- Update the delivery log with the last 10 receipts.
- Rerun the safety stock and reorder point math.
- Note any change above a few units and tell the buyer.
Put each date on the calendar and name one owner.
A review habit keeps every reorder point close to real demand.
Frequently Asked Questions
How do you calculate reorder point?
A reorder point is average daily usage times lead time in days, plus safety stock. Find usage from shipped units and lead time from your last 10 orders. Add the cushion from the worst case gap.
With 40 units a day, a 7 day lead time and 270 units of safety stock, the answer is 550.
What is a good reorder point for a slow item?
A good reorder point for a slow item is the low number the formula gives, not a round guess. A slow item with 4 units a day and a 5 day lead time has a normal case of 20 units. Add a small cushion.
Slow items often fit a simple min/max rule.
Can a spreadsheet work as a reorder point calculator?
A spreadsheet is a fine reorder point calculator for a small catalog. Six columns and one flag are enough. Update the numbers on a set schedule.
Move to automated alerts when the item count outgrows a weekly check.
Start With Your Top 20 Items
Your top 20 items are the best place to start the reorder point work. Pick them by revenue this week. Pull 90 days of shipped units and your last 10 delivery dates. Work the formula for each one.
If the sheet stops keeping up, ask providers the 3 questions above. Choose the one that keeps your accounting system and reads your real sales.
A short list done well beats a long list left alone.
Frequently asked questions
How do you calculate reorder point?
Multiply average daily usage by lead time in days, then add safety stock. With 20 units a day, a 5 day lead time and 30 units of safety stock, the answer is 130.
How to calculate EOQ and reorder point?
EOQ is the square root of (2 x yearly demand x cost per order, divided by holding cost per unit a year). Then work out the reorder point on its own. The two numbers do different jobs.
Start with a free first look
A 30 minute call, your operation mapped, and a clear picture of what we would build. No obligation and nothing to install.
Book a callRelated guides
More on the same work.
Guides
- Cycle Count Software
- Inventory Accuracy Formula
- Replenish Stock
- Cycle Counting Inventory
- Inventory Audit Checklist
- Inventory Audit
- Inventory Management Best Practices
- Abc Cycle Counting
- Moving Average Method Inventory
- Inventory Shrinkage Accounting Entry
- Inventory Shrinkage is Recorded When
- Calculate Inventory Shrinkage
- Inventory Process Flow
- Warehousing Processes
- Cycle Counting
Common questions
- Reorder Point vs Safety Stock
- What is the Point of Warehouse Management System
- What is a Good Inventory Accuracy Percentage
- How to Calculate Safety Stock in Excel
- What Common Events Could Result in Inventory Shrinkage
- How to Record Inventory Shrinkage
- What is the Cost Method to Value Inventory
- How is Shrinkage Calculated
- What is Cycle Counting in Inventory Management