


Inventory Accuracy Formula
Inventory accuracy is how closely your records match your shelves. The inventory accuracy formula is: (items counted that match the records ÷ total items counted) × 100. A score of 92% means 92 of every 100 items matched.
Our review in January 2026 covers 3 versions of the formula: by item, by location, and by dollar value. Each one has a worked example. You need a count sheet and a calculator.
Book a call
What Is the Inventory Accuracy Formula?
Accuracy is the share of counts that match your records, shown as a percent. A higher score is better. A score of 100% means every count matched the system.
The inventory accuracy formula is (items counted that match the records ÷ total items counted) × 100. The answer is always a percentage.
A record is a number in your system, such as a stock level. A match means the shelf count and the record agree. A miss means they differ by any amount.
The same math works for items, bin locations, and dollars. Pick one version and keep it.
Use one formula the same way every time, and your scores will mean something.
Why Inventory Accuracy Matters
2 costs show up when counts are wrong: lost sales and trapped cash. Every sale, order, and buying choice starts from a stock number. A wrong number sends the wrong signal.
The law also cares. IRS Publication 538 says that to figure taxable income, "you must value your inventory at the beginning and end of each tax year" (IRS Publication 538). A bad count means a bad value.
A wrong count hurts sales, cash, and tax records at once.
Stockouts and Late Orders
Stockouts are times when you have none of an item that a customer wants. The system shows 10 units. The shelf holds 0. The order waits, and the customer waits too.
The FTC sets a duty to ship when you said you would for mail, internet, and phone orders (FTC order rule guide). Good counts help you keep that promise.
Accurate counts let you promise only what you can ship.
We build it for your operation, and the first look is free
If you would rather not compare products, describe how your operation already works and we build the system around it.
No build cost. You see it running on your own process first, and the monthly subscription starts only once it is live.
Book a callExtra Stock and Tied-Up Cash
Overbuying is buying stock you already own. It happens when records show too little stock. You reorder items that sit in the back room. Cash sits on shelves instead of in the bank.
GS1 builds the barcode standards behind scan counts and says they help firms "identify, capture and share" product data (GS1 barcode standards). Clean data starts with a count you trust.
A trusted count keeps you from buying what you already have.
How Do You Calculate Inventory Accuracy Step by Step?
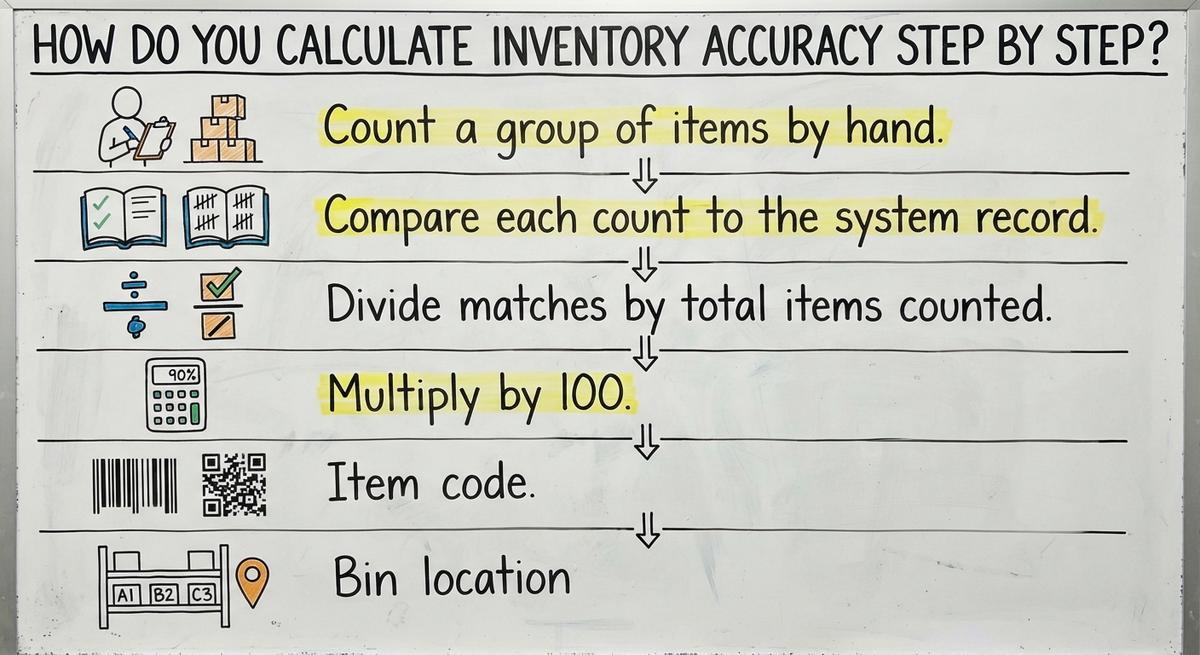
4 steps turn counts into a score. To calculate inventory accuracy, divide the items that match by the items you counted, then multiply by 100. A fifth-grade class can do it with a pencil.
- Count a group of items by hand. Pick 50 to 200 items and count each one on the shelf.
- Compare each count to the system record. Mark every item as a match or a miss.
- Divide matches by total items counted. If 45 of 50 match, the answer is 0.9.
- Multiply by 100. The result of 0.9 times 100 is 90%.
A simple count sheet has 5 columns:
- Item code: Write the SKU or part number so anyone can find the same item again.
- Bin location: Note the shelf or bin so a second counter goes to the right spot.
- System quantity: Copy the record number before the count starts, not after you see the shelf.
- Counted quantity: Write what you see on the shelf, even when it looks wrong.
- Match or miss: Mark one box for each line so the totals take seconds to add.
The score is only as honest as the count behind it, so count each item with fresh eyes.
A Worked Example With Real Numbers
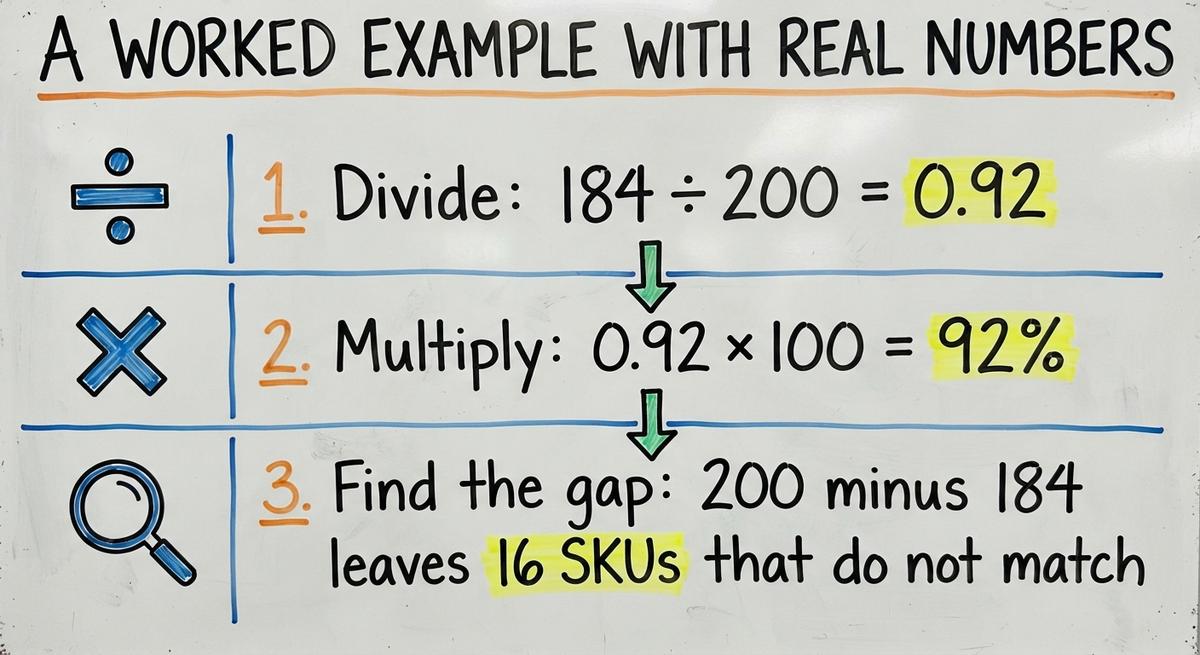
184 of 200 SKUs match the records in this example. A SKU is a stock keeping unit, one code for one product. A warehouse counts 200 SKUs, and the math is short.
- Divide: 184 ÷ 200 = 0.92.
- Multiply: 0.92 × 100 = 92%.
- Find the gap: 200 minus 184 leaves 16 SKUs that do not match.
Those 16 SKUs are your to-do list. Pull them out and look at each one. Check receipts, picks, and returns for the past 30 days.
Next, sort the 16 misses by cause. Say 9 trace to receiving, 4 to picking, and 3 to damage. Now you know where to act first.
A 92% score sounds fine until you see it as 16 wrong items out of 200. Every miss is a place where someone can ship the wrong thing.
Treat each miss as a clue, and the score becomes a repair plan.

Inventory Accuracy by Location
Location accuracy is the share of bins that hold the right item in the right amount. The formula is (locations with correct items and counts ÷ total locations checked) × 100.
Say a picker checks 120 bin locations. 108 hold the correct item and count. The math is 108 ÷ 120 = 0.90, so the score is 90%.
This version helps pickers most. A picker walks to a bin and finds it empty or full of the wrong item. Each trip like that burns minutes. A warehouse with a high location score has shorter walks and fewer calls to the office.
Location accuracy tells you where stock is. Item accuracy tells you how much exists.
Track both scores, and you will know where stock sits and how much of it you hold.
Not sure this is the right shape for your operation
Describe how the work runs today. We map it on a call and show you what it would look like built around that, before you spend anything.
Book a call
Inventory Accuracy by Dollar Value
Dollar accuracy is the share of recorded value that holds true. It measures how much money sits in the gap, not how many items miss. The formula is 1 minus (absolute dollar variance ÷ total recorded inventory value), then × 100.
Absolute variance means you add up every miss and ignore the plus or minus sign. Say you are over by $3,000 on some items and short by $2,000 on others. The absolute variance is $5,000.
Now work the math. Recorded stock is $250,000. The variance is $5,000.
- $5,000 ÷ $250,000 = 0.02.
- 1 minus 0.02 = 0.98.
- 0.98 × 100 = 98% accuracy by value.
Inventory variance is the gap between recorded and counted stock, in units or dollars.
A dollar score shows how much money the errors put at risk.
Why a Few Costly Items Matter More
1 missing $4,000 machine part hurts more than 400 missing $1 screws. A count score treats both as one miss. A dollar score shows the real hit.
The method changes the answer. Supply Chain News gives a case where "the traditional calculation would result in an accuracy level of 99.8%, using the unit volume based approach the accuracy level would be 99.93%" (Supply Chain News). Same stock, two answers.
Run both scores and compare them before you pick one.
Should You Allow a Tolerance?
Tolerance is a small gap you agree to accept before you call a count a miss. A common one is plus or minus 1 unit on low-cost items. You decide it before the count starts.
Use a tight tolerance where errors cost more:
- High-value items: Allow a gap of 0 units, as one missing piece can be worth hundreds of dollars.
- Fast-moving items: Allow a gap of 0 or 1 unit, as a small miss turns into a stockout fast.
- Cheap bulk items: Allow plus or minus 1 to 2 units on screws or labels, where a recount costs more than the miss.
Here is the effect. A bin of 500 screws shows 499. With a 1 unit tolerance, that bin counts as a match. A $900 part with the same gap counts as a miss.
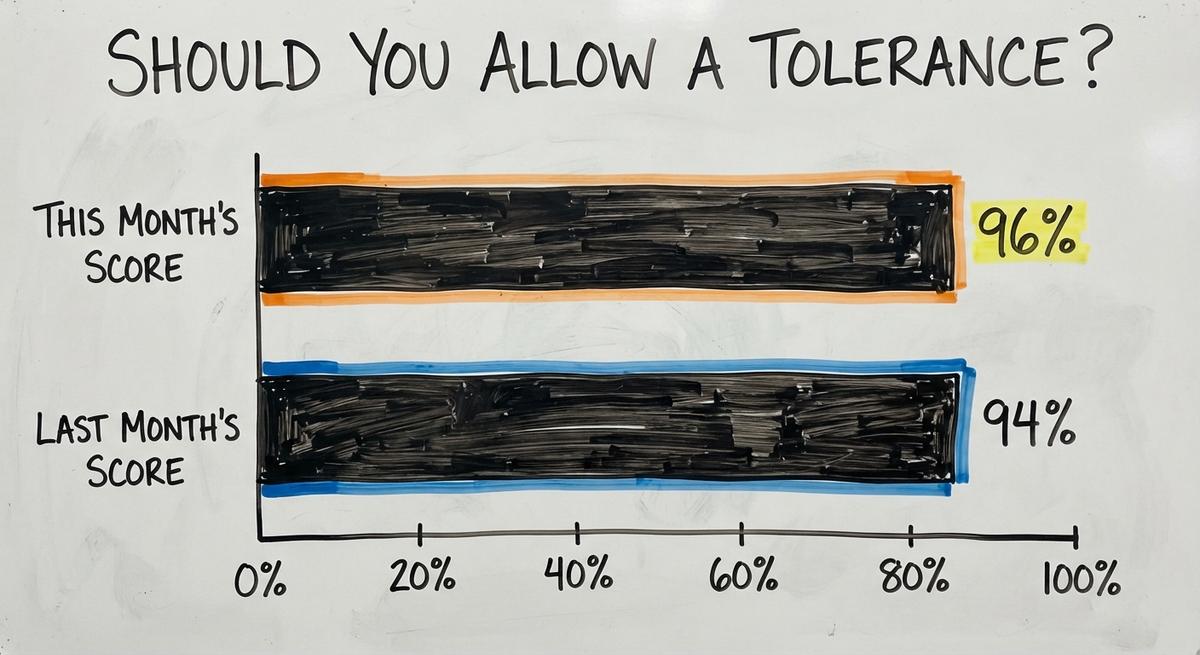
Write the rule down and post it. Every counter must score the same way, or last month's 94% and this month's 96% mean nothing.
One written tolerance rule keeps every counter on the same scale.
What Is a Good Inventory Accuracy Rate?
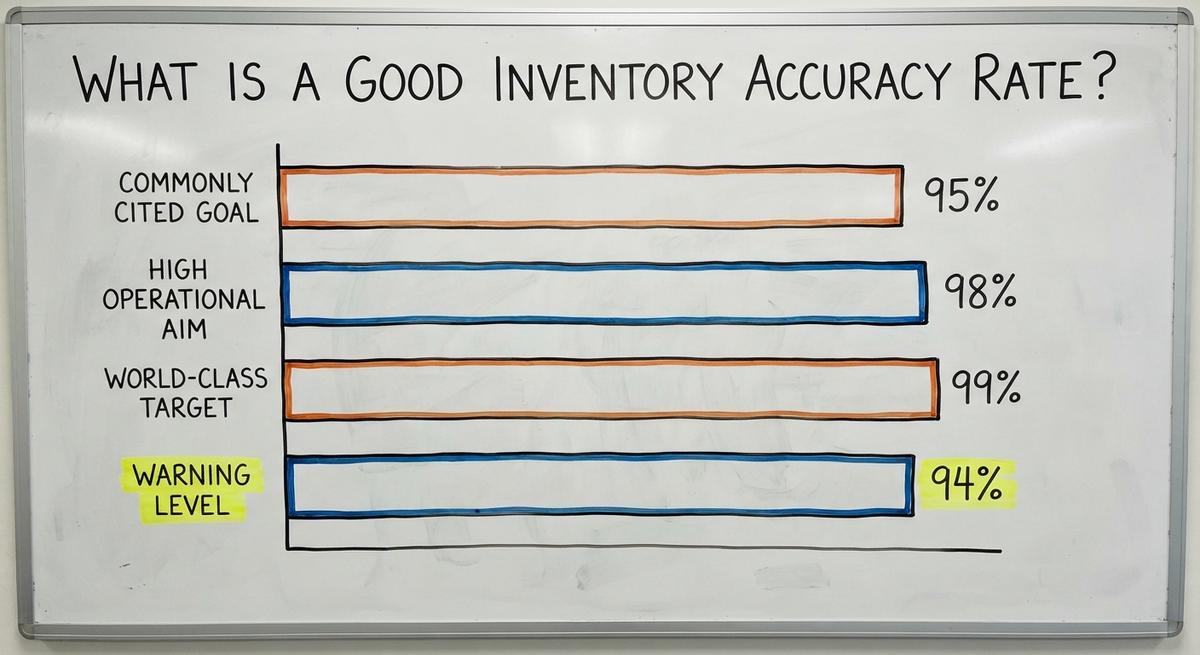
95% is a commonly cited goal for the inventory accuracy rate. Many operations aim for 98% to 99%. Treat these as general benchmarks, not rules.
Open Sky Group offers a warning level: "Anything below 94% usually points to replenishment or inventory accuracy problems upstream, not shipping problems" (Open Sky Group). A score under 94% needs a look at receiving and stocking first.
Set a target for each item class. Here is one split to start with:
- A items (top value): Aim for 99%, as each miss costs real money.
- B items (middle value): Aim for 97% to keep stock honest without extra work.
- C items (low value): Aim for 95%, as a small miss costs little.
Readers who ask for a good inventory accuracy percentage want one number. The honest answer is a range. The trend over time matters more than one score, so a climb from 88% to 94% beats a lucky 96%.
Aim for a steady climb, not a single high score.
The comparison is easier when one option is built for you
Off-the-shelf means fitting your process to the software. We do it the other way round, and the first look costs nothing.
Book a call
How to Collect the Numbers: Cycle Counts
Cycle counting is the habit of counting a small group of items on a steady schedule instead of the whole building at once.
A yearly shutdown count stops work for days. A cycle count takes an hour or two. A clerk counts 30 items on Monday and a different 30 on Tuesday. The work spreads out.
Here is a plan for 600 items. At 30 items a day, the full set is counted in 20 working days. Every item gets a fresh check each month.
Each cycle count yields fresh data for the formula. Compare each stock count to the record, mark match or miss, and log the score. Over a month the scores show a pattern.
Small, frequent counts also catch errors while the cause is still fresh in someone's memory.

How Often Should You Measure Accuracy?
Frequency is set by how fast stock moves and what it costs. Most small operations should measure inventory accuracy weekly or monthly.
Use the ABC approach. ABC means you sort items by value and sales, then count the top group more frequently.
- A items: The top 20% by value get counted every month or even every week.
- B items: The next group gets counted every quarter.
- C items: The cheap tail gets counted once or twice a year.
Keep the same method each time. If you count by item in March and by dollars in April, the two scores cannot be compared. Fair trends need one method.
Count the costly items most, and use one method every time.

Common Reasons Your Score Is Low
4 causes explain most low scores. When your inventory count does not match your records, one of these is almost always the answer.
- Receiving errors and unrecorded returns: A box arrives and no one logs it, or a return goes back on the shelf unrecorded.
- Wrong item or wrong quantity picked: A picker grabs a look-alike item or one extra case, and the order ships.
- Damaged, lost, or stolen stock never written off: The record says 12 units. The shelf holds 9 and no one adjusted it.
- Unit of measure mix-ups: Case versus each is a classic. A record of 1 case can be 24 units.
Most misses trace back to a human step, so start there.
How Manual Tracking Hurts Accuracy
Manual tracking is a chain of hand-offs, and each one risks a wrong number. Printed sheets, spreadsheet files, and email updates drift out of sync with your accounting software's inventory records.
One person updates the sheet. Another updates the books a day later. A third reads an old email. Now 3 versions of one number exist.
Retyping the same number in several places invites typos. The BLS tracks pay for shipping, receiving, and inventory clerks (BLS occupational data). Say 3 clerks each spend 5 hours a week fixing mismatches at $20 an hour. That is 3 × 5 × $20 × 52 = $15,600 a year.
Add the lost sales from each stockout, and the true cost climbs higher. Time spent on fixes is time not spent on counts.
Fewer hand-offs mean fewer errors.

How to Find the Cause of a Mismatch
3 checks find the cause of most mismatches, in order. Start with the cheapest one and work down.
- Recount first. A second counter rules out a counting mistake, the most common cause.
- Check recent movements. Review receipts, picks, transfers, and adjustments for that item over the past 30 days.
- Look for patterns. Group misses by person, shift, location, or supplier and see which group stands out.
If 8 of 10 misses come from one supplier, the problem sits at the receiving dock. If they cluster on one shift, the problem is training or timing.
Write the cause next to each miss on the count sheet. After a few weeks, the same names repeat, and the fix becomes clear.
A pattern points to a cause, and a cause is what you can fix.
See it running on your own process first
No build cost. The subscription starts once it is live and doing the job, not before.
Book a callSimple Ways to Raise Your Accuracy
4 small habits raise inventory accuracy without a big system change. They cost little and start this week.
- Label every bin and shelf clearly. A clear label means a picker never has to guess where an item lives.
- Record stock moves when they happen. A move written down at day's end is a move half forgotten.
- Use barcode scanning where the budget fits. A scan removes the typing step that causes many entry errors.
- Limit who can adjust counts and log every change. Fewer hands on the numbers means fewer silent edits.
The NIST Manufacturing Extension Partnership offers vendor-neutral guidance on supply chain process (NIST MEP). Start with one habit this week and add another next month.
Small habits, kept daily, beat big projects that stall.

How Does Inventory Accuracy Differ From Related Measures?
Accuracy is the base for 3 other measures. Inventory accuracy asks one question: do my records match the shelf? The others ask different questions.
- Fill rate: What share of orders did we ship in full?
- Shrinkage: How much stock value did we lose to theft, damage, or error?
- Inventory turnover: How fast does stock sell and get replaced?
Open Sky Group puts the link plainly: "Anything below 94% usually points to replenishment or inventory accuracy problems upstream" (Open Sky Group).
The Census Bureau tracks the inventories-to-sales ratio for wholesale firms (Census wholesale trade). The average days to sell inventory formula and the total cost of inventory formula both use your recorded stock. A wrong count bends every one of them.
Fix the count first, and the other measures get more reliable.
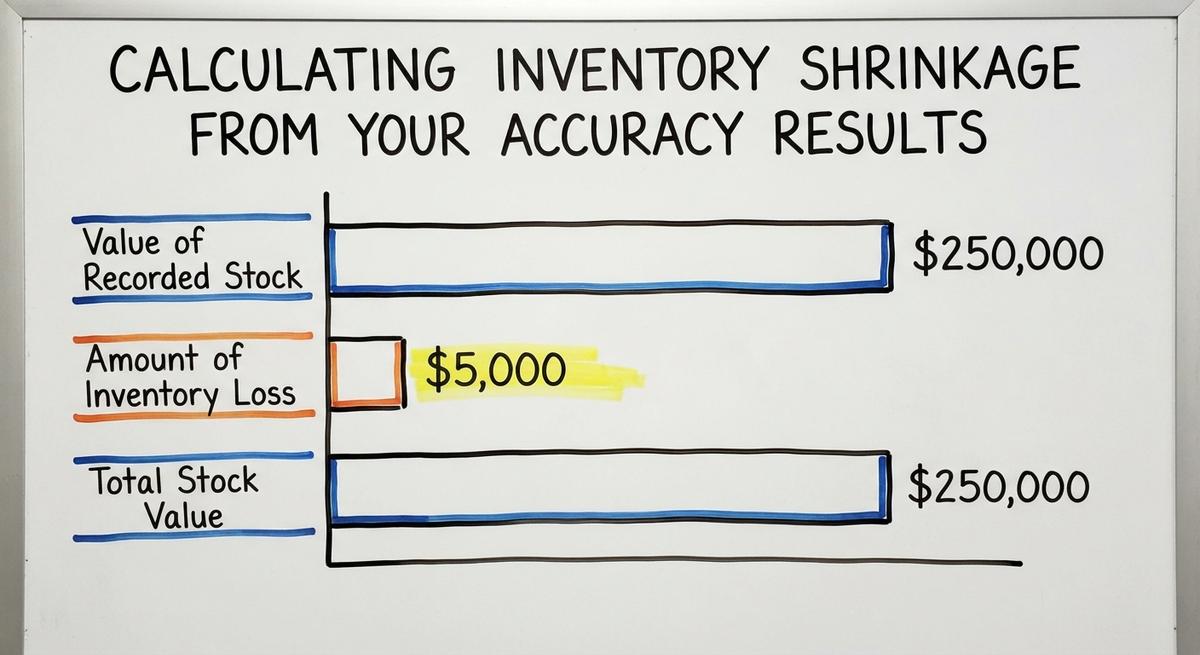
Calculating Inventory Shrinkage From Your Accuracy Results
Shrinkage is the loss of stock value between what records say and what you hold. The formula is (recorded value minus actual value) ÷ recorded value × 100.
Say your books show $250,000 of stock. A count finds $245,000. The gap is $5,000. Then $5,000 ÷ $250,000 = 0.02, so shrinkage is 2%.
Shrinkage is the cost side of the same gap. Accuracy shows how often you miss. Shrinkage shows how much the miss cost you in dollars.
When all your variance is loss, shrinkage equals 100 minus your dollar accuracy. Here that is 100 minus 98, or 2%.
If some misses are overages, the two numbers will differ. Net the plus and minus for shrinkage, but ignore the signs for accuracy.
Shrinkage and accuracy tell one story from two sides.

Mistakes to Avoid When Measuring Accuracy
4 mistakes ruin an accuracy score fast. Each one makes the number look better than the truth.
- Counting only easy items: Items at eye level and near the door skew the score upward.
- Counting while stock is still moving: A pick during the count creates a fake miss.
- Changing the method each time: A new method each month makes trends meaningless.
- Fixing the number without fixing the cause: A quiet adjustment hides the problem and it returns next month.
A score is a tool for finding problems, so do not tune it to look good.
Quick Start Checklist
1 afternoon is enough for your first accuracy check. Follow these steps in order.
- Pick a sample. Choose 100 items or 50 bin locations across all areas of the building.
- Count, compare, calculate. Use the formula and write the result with the date.
- Set a target and a schedule. Choose 95% or higher and pick a repeat day each month.
- List the top 3 causes. Fix the biggest one first and recheck next month.
A written score with a date is worth more than a guess in your head.
Frequently asked questions
Is 95% inventory accuracy good?
Yes, 95% is a common minimum goal. Many teams push to 98% or 99% on costly or fast-moving items. Set a separate target for each item class instead of one number for all stock.
Can I measure inventory accuracy by value?
Yes. Subtract your absolute dollar variance divided by total recorded value from 1, then multiply by 100. A $5,000 gap on $250,000 of stock scores 98%. Count scores and dollar scores answer different questions.
How many items should I count for an accuracy check?
Start with 50 to 200 items per round. Pick across zones, value classes, and fast and slow movers. A sample that covers the whole building gives a fairer score than a large sample from one aisle.
Does an accounting package track inventory accuracy on its own?
No. Your accounting software holds your stock records. It cannot see the shelf. You must count items by hand or by scan and compare each count against that record.
What is the formula for inventory accuracy by location?
Divide the locations holding the correct item and count by the total locations checked, then multiply by 100. If 108 of 120 bins are right, your location score is 90%.
What does absolute dollar variance mean?
Absolute dollar variance is the total of every count miss with the plus and minus signs removed. If you are over by $3,000 and short by $2,000, the absolute variance is $5,000.
How often should a small business run a cycle count?
Run one weekly or monthly. Count your highest-value items most often and cheap items once or twice a year. Keep the same method each round so scores compare fairly.
Start with a free first look
A 30 minute call, your operation mapped, and a clear picture of what we would build. No obligation and nothing to install.
Book a callRelated guides
More on the same work.
Guides
- Stock Turnover Ratio Formula
- Average Days to Sell Inventory Formula
- Total Cost of Inventory Formula
- Cycle Counting Inventory
- Inventory Audit Checklist
- Inventory Audit
- Inventory Management Best Practices
- Moving Average Method Inventory
- Inventory Shrinkage Accounting Entry
- Inventory Shrinkage is Recorded When
- Calculate Inventory Shrinkage
- Inventory Process Flow
- Inventory Pricing Methods
- Warehouse Inventory Management Software
- Warehouse Inventory Tracking Software
- Warehouse Inventory Management Systems
- Best Inventory Software
- Quickbooks Inventory Management Software
- Warehouse Inventory Systems