


Calculate Inventory Shrinkage
Inventory shrinkage is the gap between book stock and counted stock. Subtract your count from your book value to calculate inventory shrinkage.
Book a callWhat Is Inventory Shrinkage?
Inventory shrinkage is a loss of goods, not a loss of sales. Say your records show 1,000 cases. A count finds 970. The 30 missing cases are shrinkage.
Wholesalers and warehouses feel this loss most. Staff handle many SKUs. A SKU is one unique item code. Many hands touch each one, and each item moves many times. Every touch is a chance for a slip.
Every step works with plain records and a pen.
Shrinkage is stock that your books say you own and your shelves do not hold.
We build it for your operation, and the first look is free
If you would rather not compare products, describe how your operation already works and we build the system around it.
No build cost. You see it running on your own process first, and the monthly subscription starts only once it is live.
Book a callWhy You Should Calculate Inventory Shrinkage
Shrinkage is cash that already left your bank account. You paid the vendor. You cannot sell the goods. A number you track can be fixed. A number you guess at cannot.
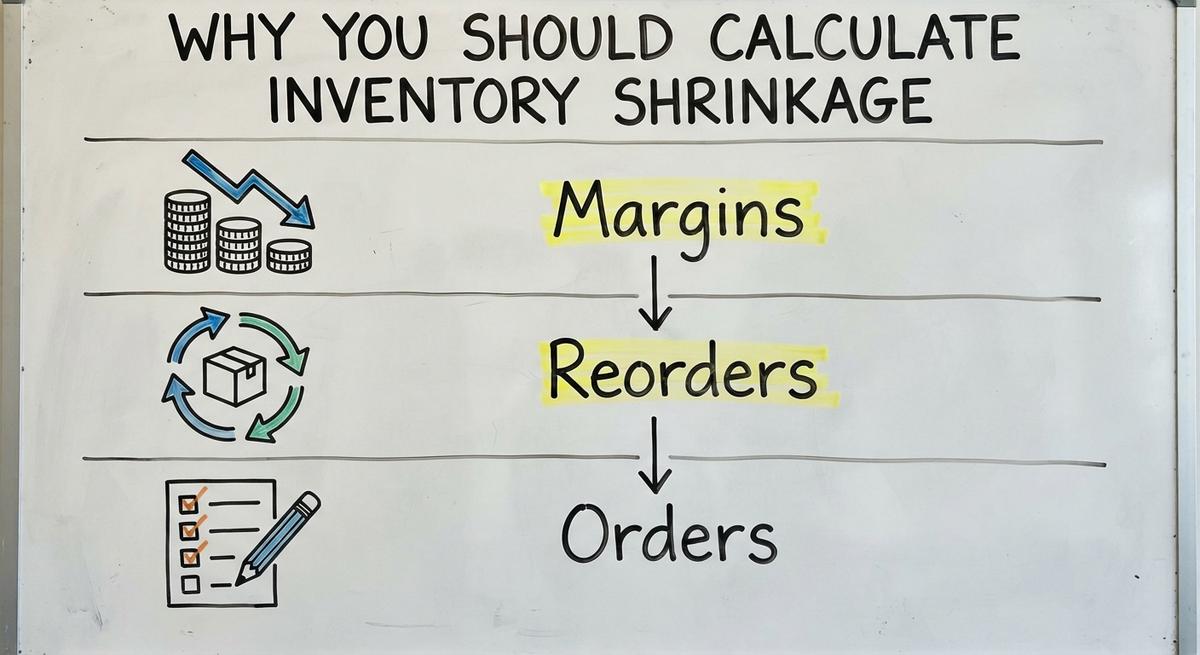
The loss shows up in three places:
- Margins: Missing goods raise your real cost on every item you do sell.
- Reorders: Wrong counts trigger buys you do not need or miss buys you do.
- Orders: Short stock leads to late or short shipments to your buyers.
The law also asks for counts. In IRS Publication 538, the agency says "you must value your inventory at the beginning and end of each tax year." Scan-based counts help too, and GS1 barcode standards are the base for most of them.
A tracked number tells you where to spend your time first.
What Is the Inventory Shrinkage Formula?
The inventory shrinkage formula is book inventory minus actual inventory. Book inventory is what your accounting package or sheets say you hold. Actual inventory is what a physical inventory count finds on the shelves.
Shrinkage = Book inventory value − Actual inventory value
Use units or dollars. Units show you which items vanish. Dollars show you what the loss costs. Run both when you can.
A positive result means stock is missing. A negative result means you hold more than the books say. That also needs a look, since it points to a receiving or entry error.
The formula is one subtraction, and the care goes into the two inputs.
How to Calculate Inventory Shrinkage Percentage
The inventory shrinkage percentage is (book value minus actual value) divided by book value, times 100. Owners also call it the shrinkage rate.
A percentage beats a dollar figure when you compare periods. Sales and stock grow. A $5,000 loss means more in a small month than in a big one. The percent keeps the test fair.
Find your starting book value in your accounting package. Look at the inventory asset line on the balance sheet. Or pull it from your stock sheet total. If you need a start figure, see how to calculate beginning inventory.
Round to 1 or 2 decimals. A rate of 3.04% is clear enough.
The percentage turns one loss into a trend you can watch.
Not sure this is the right shape for your operation
Describe how the work runs today. We map it on a call and show you what it would look like built around that, before you spend anything.
Book a callStep-by-Step: How to Calculate Inventory Shrinkage
The process has 5 steps. If you wonder how is shrinkage calculated, this is the short answer. The same steps work for a 5-person shop or a 100-person warehouse.
- Pick a time period.
- Get the book inventory number.
- Count the actual stock.
- Compare the two and do the math.
- Record the result and the reasons.
The next 4 sections cover each step in turn. Step 5 sits inside step 4.
Follow the steps in order and the number holds up.
Step 1: Pick Your Time Period
A time period is the window your shrinkage number covers. Monthly, quarterly, and yearly are the common picks. Fast movers fit a month. Slow stock fits a quarter or a year.
Use the same period each time. A 1-month loss and a 12-month loss cannot be compared side by side.
Match the period to a count you already do. Many firms count at year end for tax reasons. Start there. Add a quarterly count when the first one runs smooth.
Write down the start date and end date. Every receipt and shipment in that window must land in the same book.
A steady period gives you numbers that compare fairly.
Step 2: Get Your Book Inventory Number
Book inventory for a period is start value plus buys and receipts, minus cost of goods sold. Cost of goods sold is what you paid for the items you shipped. If your records lack an ending figure, read how to calculate cost of goods sold without ending inventory.
Pull the number from your accounting package or your stock sheets. Then check three things:
- Receiving: Every dock receipt for the period is posted in the books.
- Shipping: Every shipped order is posted and matched to its invoice.
- Cutoff: Pick one hour and freeze movement during the count.
Cutoff time matters most. A pallet shipped mid-count shows as a loss when it is not.
A clean book number needs posted records and a firm cutoff.
Step 3: Count Your Actual Inventory
A physical inventory count is a hands-on tally of every item on your shelves. You have two ways to do it. A full count checks everything at once. Cycle counting checks a few items at a time, all year.
Use these rules for either one:
- Count by bin: Walk the bins in order so no spot is skipped or counted twice.
- Double up on value: Use two counters on high-value items and compare the tallies.
- Record in one place: Use one sheet or one device, not scraps of paper.
- Tag counted bins: A tag or sticker shows a bin is done.
Ship no goods and receive none until the count ends.
One method, one record, and two sets of eyes keep the count honest.
How Do You Compare Book and Actual Counts?
You compare them by subtracting actual from book, item by item and in total. Then sum the item gaps and check that they match the total gap.
Value each item at cost, not at sale price. Sale price hides what you truly lost.
Flag the items with the largest dollar gaps. Start your search there. Small gaps on cheap items can wait.
Record the result with the date, the period, and the counters. Add a short note on each large gap. You will want it later.
The item list, sorted by dollar gap, is the page you act on.

Inventory Shrinkage Example With Real Numbers
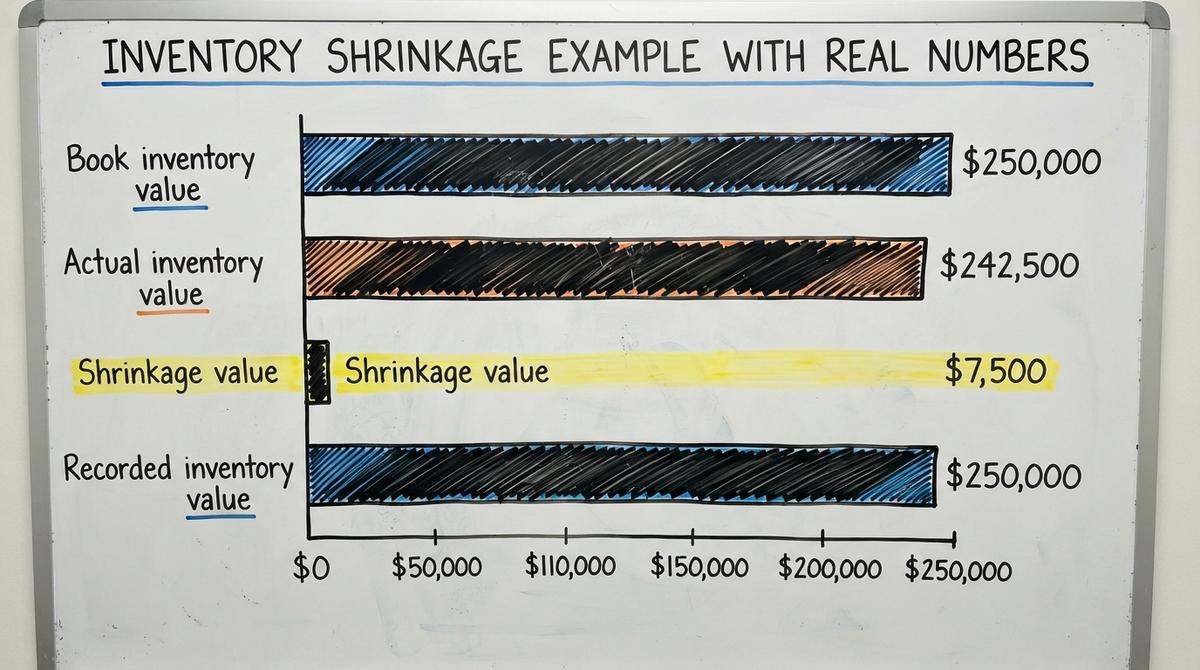
The inventory shrinkage example below uses made-up figures for teaching. It is not a benchmark. Your numbers will differ.
| Line | Value |
|---|---|
| Book inventory value | $250,000 |
| Actual inventory value | $242,500 |
| Shrinkage value | $7,500 |
| Shrinkage percentage | 3% |
Step by step: $250,000 minus $242,500 is $7,500. Next, $7,500 divided by $250,000 is 0.03. Times 100 gives 3%.
In plain words, the books say you hold $250,000 of goods. The shelves hold $242,500. You lost $7,500, or 3 cents of every book dollar.
Now the real work starts: find out why.
The comparison is easier when one option is built for you
Off-the-shelf means fitting your process to the software. We do it the other way round, and the first look costs nothing.
Book a callWhat Is a Normal Inventory Shrinkage Rate?
The NRF National Retail Security Survey 2022 covers retail loss. It is a retail source, so do not copy its figures onto a warehouse. For wholesale context, the US Census Bureau wholesale trade data shows national inventories and sales.
A normal inventory shrinkage rate depends on your industry, your product, and your handling steps. No single figure fits a distributor of tires and a distributor of fresh food.
A better benchmark is your own rate over time. Track it each period. A rising trend is a warning sign, even when the number looks small.
Your own trend line is the benchmark that matters.

Common Causes of Inventory Shrinkage in Warehouses
Warehouse inventory shrinkage has six common causes. Knowing the causes of inventory shrinkage tells you where to look first.
- Count and entry errors: A mistyped quantity makes good stock look lost.
- Receiving mistakes: A short shipment goes uncaught and the books show the full amount.
- Picking and shipping errors: Staff send the wrong item or too many units.
- Damage and spoilage: Broken, wet, or expired goods leave the shelf without a record.
- Theft: Staff, vendors, or outsiders take stock.
- Unrecorded returns or transfers: Goods move between sites with no entry.
Most firms find that several causes work at once. Small errors add up.
Most shrinkage comes from ordinary slips, and only some comes from theft.
How to Find Where Shrinkage Is Coming From
Finding the source means breaking the total into smaller pieces. A single number tells you little. Split it by product, location, shift, and process step.
Then look for patterns:
- Same SKU: One item that keeps coming up short may have a bad unit of measure.
- Same bin: A bin with repeat gaps may be hard to reach or poorly labeled.
- Same day or shift: A pattern by weekday points to a staffing or process gap.
Compare receiving records to buy orders. Short shipments show up fast. Then review each adjustment entry and see who made it.
For process help, the NIST Manufacturing Extension Partnership offers vendor-neutral supply chain guidance.
A pattern in the data points you to a cause, and the cause points to a fix.

Why Manual Tracking Hides Shrinkage
Manual tracking hides shrinkage because the book number is not reliable. Data sits in an accounting package, a spreadsheet, a database file, paper, and email. Each copy can differ.
Retyping makes it worse. A flipped digit looks like a loss. A missed line looks like theft. Staff then chase ghosts.
Yes, you can calculate shrinkage with an accounting package plus spreadsheets. The result is only as good as the match between them. Say 2 people spend 5 hours a week fixing sheets at $20 an hour. That is $10,400 a year. The Bureau of Labor Statistics lists pay for inventory clerks, so you can swap in local rates.
Scattered records turn normal errors into missing stock.
See it running on your own process first
No build cost. The subscription starts once it is live and doing the job, not before.
Book a callHow Do You Reduce Inventory Shrinkage?
You reduce inventory shrinkage by closing the gaps where stock enters, moves, and leaves. Once you know your number, act on these five steps:
- Check at the dock: Match every shipment to its buy order before you sign.
- Run cycle counts: Count fast and high-value items often, so errors surface early.
- Limit adjustments: Let few people change stock levels and log every change.
- Label clearly: Mark each bin and location so picks go to the right spot.
- Secure valuables: Lock up high-value goods and track who holds the key.
Start with the step that hits your biggest dollar gap. Measure again next period.
Each fix is small, and the gains add up with every count.

How Often Should You Calculate Inventory Shrinkage?
Calculate inventory shrinkage at least once a year. Quarterly or monthly is better for fast movers. Slow stock needs fewer checks.
Cycle counts let you measure all year without a shutdown. You count a slice each day or week. In time you cover every item.
Consistent timing beats perfect timing. A count on the last Friday of each month tells you more than a perfect count done once.
A steady schedule shows you the trend, and the trend drives action.
Shrinkage vs. Inventory Adjustments and Write-Offs
Shrinkage is the loss you find. An adjustment is the entry that fixes the books. They are two steps, not one.
A write-off covers known losses, such as damaged or expired goods. You know the cause when you write it off. Shrinkage often has no known cause yet.
Put a reason code on every adjustment. Codes such as damage, count error, and theft keep causes visible. Without them, the books balance and the cause is gone.
For the inventory shrinkage accounting entry, ask your accountant. Ask too when inventory shrinkage is recorded, since timing rules vary by firm.
The adjustment fixes the books, and the reason code keeps the lesson.

Mistakes to Avoid When You Calculate Inventory Shrinkage
Five mistakes ruin an otherwise good count:
- Counting while stock moves: Goods in transit make the gap look larger or smaller than it is.
- Mixing values: Book value at cost and counts at sale price will never match.
- Ignoring timing: A receipt posted after the count looks like a gain.
- Fixing without finding: Adjusting the books hides the problem and it returns next period.
- Tracking only the total: A single figure hides which items and steps leak.
The FTC rule on mail, internet, and phone orders asks you to ship when you said you would. An accurate count backs that promise.
Avoid these five errors and the number you get is one you can trust.
Frequently asked questions
How do you calculate inventory shrinkage?
Subtract your counted stock value from your book stock value. The result is the loss. Do it for the whole stock and again for each item to spot the biggest gaps.
What numbers do I need before I start?
You need two figures: the book value from your accounting package or sheets, and the value of a fresh physical count. Value both at cost, and use the same cutoff date.
Can I calculate shrinkage if I track stock in an accounting package and spreadsheets?
Yes. Pull the book number from the package and match it to your sheets first. Fix any mismatch before the count, or retyping errors will look like missing stock.
What is the formula for inventory shrinkage percentage?
Subtract actual value from book value, divide by book value, then multiply by 100. A $7,500 gap on $250,000 of book stock gives a 3% rate.
What is a normal shrinkage rate for a warehouse or distributor?
The rate varies by product and process, so no single figure fits everyone. Compare your rate against your own past periods. A rising trend is the real warning sign.
How often should I calculate shrinkage?
Do it once a year at minimum. Fast movers fit monthly or quarterly checks. Cycle counts let you measure all year, and a steady schedule matters more than a perfect one.
What causes inventory shrinkage?
Common causes are entry errors, missed short shipments, wrong picks, damaged or expired goods, theft, and unrecorded transfers. Most losses come from ordinary slips, not from theft.
How do I find out where the loss is coming from?
Split the total by product, location, shift, and process step. Look for repeat patterns, match receipts to buy orders, and read each adjustment with its reason code.
Start with a free first look
A 30 minute call, your operation mapped, and a clear picture of what we would build. No obligation and nothing to install.
Book a callRelated guides
More on the same work.
Guides
- Inventory Shrinkage Accounting Entry
- Inventory Shrinkage is Recorded When
- Calculate Beginning Inventory
- Inventory Audit Checklist
- Inventory Management Best Practices
- Moving Average Method Inventory
- Inventory Process Flow
- Warehouse Inventory Management Software
- Warehouse Inventory Tracking Software
- Warehouse Inventory Management Systems
- Best Inventory Software
- Quickbooks Inventory Management Software
- Warehouse Inventory Systems
- Classification of Inventory
- Inventory and Warehouse Management Software
- Custom Inventory Management Software
- Excess Inventory