


How to Calculate Safety Stock in Excel
Safety stock is extra inventory you hold to cover surprise demand or late supplier deliveries. The formula looks like this: =NORM.S.INV(0.95)STDEV.S(B2:B53)SQRT(D2).
Reviewed November 2026.
To calculate safety stock in Excel, multiply three numbers.
Those are the Z-score, the standard deviation of weekly demand, and the square root of lead time.
Formulas.
Book a callWhat Is Safety Stock and Why Calculate It in Excel?
Safety stock is the buffer of units that sits above your normal supply.
Picture a distributor who sells 100 cases a week.
A supplier ships 1 week late.
Without a safety stock buffer, the shelf goes empty.
What safety stock prevents
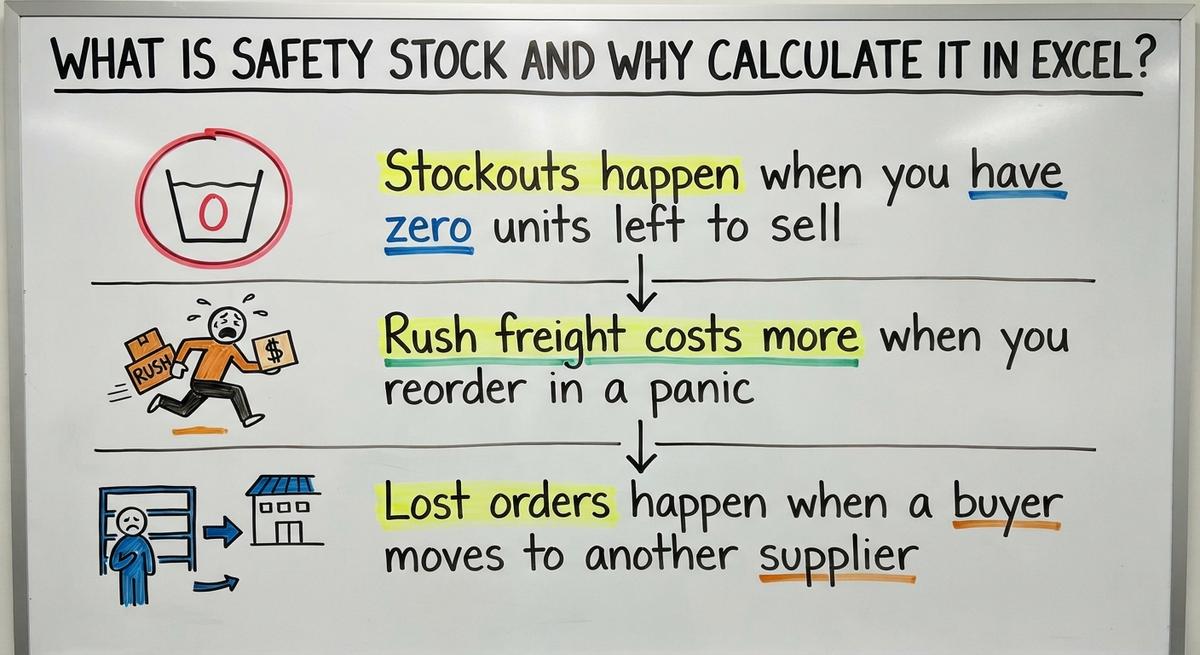
A good safety stock buffer stops 3 costly problems:
- Stockouts happen when you have zero units left to sell.
- Rush freight costs more when you reorder in a panic.
- Lost orders happen when a buyer moves to another supplier.
A lost buyer may not come back.
A small buffer costs far less than all 3 of these.
The cost of a few extra units is steady and easy to predict.
The cost of running out can be large and hard to recover.
Why Excel works for a safety stock calculation
Excel is a fast tool for a safety stock calculation.
Most small distributors already hold sales data in accounting exports and spreadsheets.
The sheet is easy to check.
It suits a small number of SKUs. A SKU is one unique item you stock.
Tax rules already force you to count stock. IRS Publication 538 says, "To figure taxable income, you must value your inventory at the beginning and end of each tax year."
An inventory spreadsheet adds safety stock math to counts you already make.
We build it for your operation, and the first look is free
If you would rather not compare products, describe how your operation already works and we build the system around it.
No build cost. You see it running on your own process first, and the monthly subscription starts only once it is live.
Book a callWhat Data Do You Need to Calculate Safety Stock?
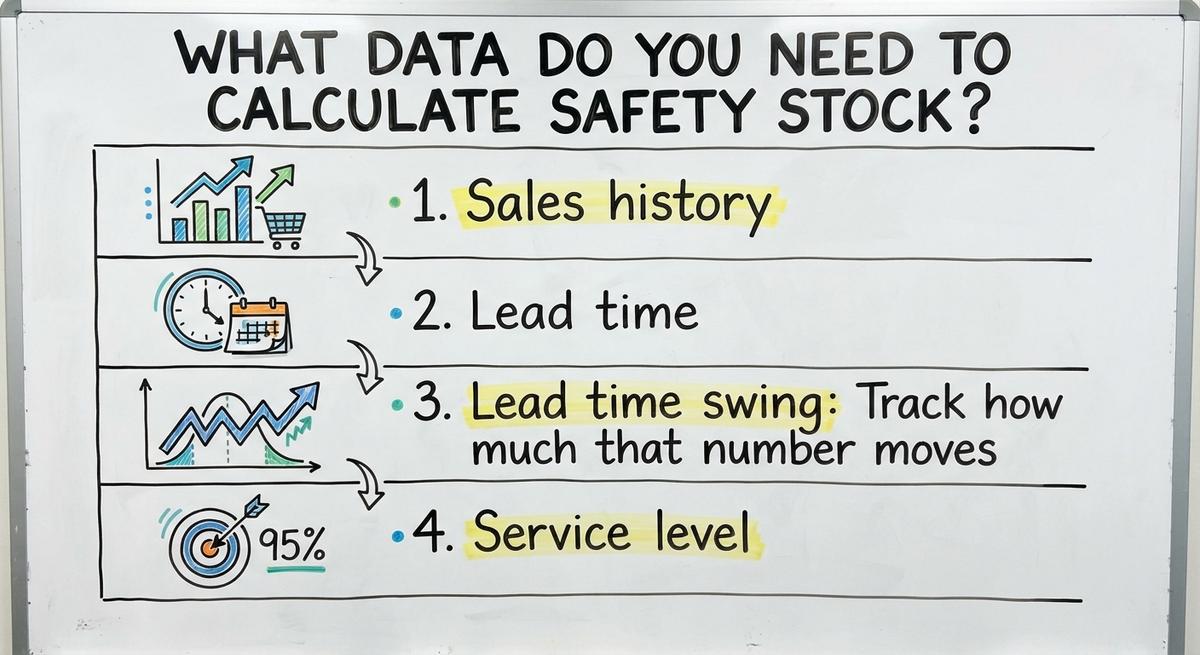
You need 3 inputs to calculate safety stock: sales history, lead time, and a service level.
Gather them first and the rest takes minutes.
- Sales history: Pull weekly or daily sales for each item, ideally 6 to 12 months.
- Lead time: Note how many days or weeks a supplier takes to deliver.
- Lead time swing: Track how much that number moves.
- Service level: Pick the share of restock cycles with no stockout, such as 95 percent.
Tip: export sales by item from your accounting package into a clean spreadsheet.
A popular small-business bookkeeping program works fine.
Use one row per week and one column per item.
Delete returns and test orders before you start.
What Is the Safety Stock Formula?
The safety stock formula comes in 2 forms.
One is simple. The other uses statistics.
Pick the one that fits how steady the item sells.
Simple safety stock method
Use this method for steady items.
These are products with stable sales and stable supplier lead times.
(Max daily sales x max lead time) minus (average daily sales x average lead time)
Max means the highest value you saw in your records.
Average means the typical value.
The gap between worst case and normal case is your safety stock.
You plan for a very busy stretch plus a late delivery.
Then you hold enough stock to cover the difference.
Statistical safety stock formula
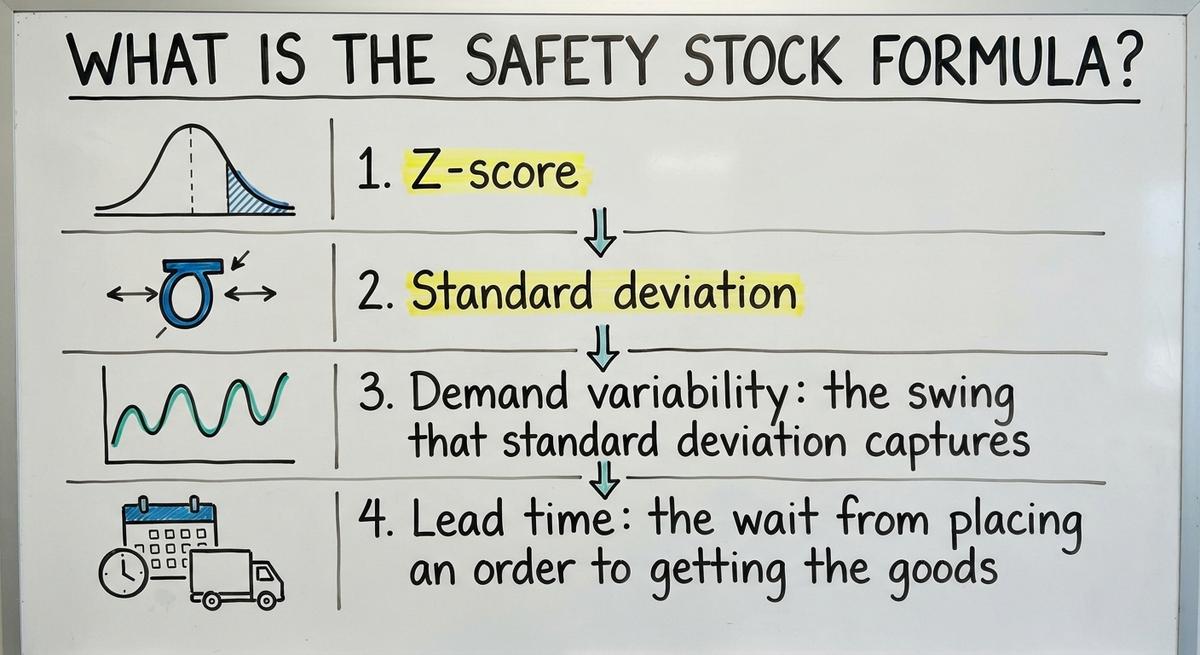
The statistical formula fits items with big swings in demand:
Z-score x standard deviation of demand x square root of lead time
- Z-score: a number that turns your service level into a safety margin.
- Standard deviation: a measure of how far weekly sales stray from the average.
- Demand variability: the swing that standard deviation captures.
- Lead time: the wait from placing an order to getting the goods.
Swingy items need the statistical method.
The simple one overstates or understates the risk.
Not sure this is the right shape for your operation
Describe how the work runs today. We map it on a call and show you what it would look like built around that, before you spend anything.
Book a callHow to Calculate Safety Stock in Excel Step by Step
Excel needs 4 functions to calculate safety stock: AVERAGE, STDEV.S, NORM.S.INV, and SQRT.

Here is the order to use them.
The five steps for safety stock in Excel
- Put weekly sales in one column, such as B2:B53.
- Find average demand with =AVERAGE(B2:B53).
- Find variation with =STDEV.S(B2:B53).
- Enter lead time in weeks in a cell, such as D2.
- Get the Z-score with =NORM.S.INV(0.95) after you enter your service level.
Then multiply it all: =NORM.S.INV(0.95)STDEV.S(B2:B53)SQRT(D2).
Demand and lead time must share one time unit.
Weekly sales need lead time in weeks.
Daily sales need days.
A worked safety stock example
The numbers in this safety stock example are made up.
They serve as an illustration only.
Average demand is 100 units a week.
Standard deviation is 20.
Lead time is 4 weeks.
Service level is 95 percent, so Z is about 1.65.
The math: 1.65 x 20 x 2 = 66 units of safety stock.
The 2 is the square root of 4 weeks.
How do you pick a service level for safety stock?
Service level is the chance you will not run out during one restock cycle.
A higher level ties up more cash in stock.
Common Z-scores for a safety stock calculation:
- 90 percent has a Z-score of about 1.28.
- 95 percent has a Z-score of about 1.65.
- 99 percent has a Z-score of about 2.33.
Set higher levels for best sellers.
Set lower levels for slow movers.
Cash goes where a stockout hurts most.

How Do You Turn Safety Stock Into a Reorder Point?
The reorder point is the stock level that tells you to place a new order.
The formula is (average demand x lead time) + safety stock.
Continue the example: (100 x 4) + 66 = 466 units.
When on-hand stock falls to 466, you reorder.
Add a column to your safety stock sheet to make this automatic:
- Put the reorder point in one column.
- Put on-hand stock in the next column.
- Select the on-hand column and open Conditional Formatting.
- Add a rule that colors a cell red at or below the reorder point.
Red cells show you what to order today.
The same habit helps you learn how to keep stock levels week after week.
The comparison is easier when one option is built for you
Off-the-shelf means fitting your process to the software. We do it the other way round, and the first look costs nothing.
Book a call
What Mistakes Make Safety Stock Calculations Wrong?
Five common mistakes make a safety stock calculation wrong.
Each one is easy to fix.
- Mixing days and weeks inflates or shrinks the result. Keep one unit.
- Using too little history hides real swings.
- Keeping a big one-off order skews the average, so remove it.
- Ignoring supplier delays leaves you short. Add the worst delays to your data.
- Setting the number once lets it go stale as sales change.
- Using one service level for every item wastes cash on slow movers.
Clean inputs matter more than clever formulas.

How Often Should You Update Safety Stock in Excel?
Review safety stock at least every quarter, or every 3 months.
Check sooner for seasonal items and after a supplier change.
A simple routine keeps your safety stock sheet honest:
- Paste in the latest sales export.
- Check that the formulas still point at the right cells.
- Log any big change on a separate tab with the date and reason.
A change log tab lets the whole team see why a number moved.
Cycle stock is the part of inventory that covers normal demand.
It deserves the same review.
See how to calculate cycle stock for that side of the math.


When Does Excel Stop Being Enough for Safety Stock?
Excel stops being enough when the sheet costs more time than the stock it protects.
The signs are easy to spot:
- You track hundreds of SKUs.
- Several people edit separate copies of the file.
- Exports go stale within days.
- Formulas break when someone inserts a row.
- Sheet counts differ from the shelf or the accounting package.
Mismatched counts are a warning sign.
Learn how to prevent stock discrepancies before they grow.
Learn how to resolve a stock discrepancy once one appears.
When you outgrow the sheet, look for a setup that pulls live data.
It should flag low items.
It should keep your accounting package in place instead of forcing a full replacement.

Start With One Item to Calculate Safety Stock
Export 52 weeks of sales so you can see a full year of demand.
Pick your top seller today.
Run the five steps for safety stock in Excel.
Compare the result with what sits on the shelf.
One item shows you quickly whether your buffer is too thin or too fat.
It gives you a clear starting point.
Then repeat the process for the rest of your catalog.
Frequently asked questions
Is there a single best safety stock formula?
No. The simple max and average method suits steady items. The Z-score method suits items with big demand swings. Choose by how much weekly sales vary from the average.
How much sales history do you need for a safety stock calculation?
Six to 12 months of weekly sales is a good base. Fewer than 26 weeks hides real swings. Seasonal items need a full year to show their pattern.
What Excel functions do you need for safety stock?
You need AVERAGE, STDEV.S, NORM.S.INV, and SQRT. Together they give average demand, spread, the Z-score, and the lead time adjustment in a few cells.
Can Excel handle many SKUs?
Excel handles dozens of SKUs well. Past a few hundred, file size, copy errors, and stale exports slow the work and raise the chance of broken formulas.
Should every item get safety stock?
No. Skip buffers for items you can reorder in a day, items that rarely sell, and made-to-order goods. Spend buffer cash on fast sellers with long lead times.
How do you calculate a reorder point from safety stock?
Multiply average demand by lead time, then add safety stock. With 100 units a week, 4 weeks, and 66 units of buffer, you reorder at 466 units.
Start with a free first look
A 30 minute call, your operation mapped, and a clear picture of what we would build. No obligation and nothing to install.
Book a callRelated guides
More on the same work.
Guides
- Calculate Inventory Shrinkage
- Replenish Stock
- Ms Excel Inventory Template
- Inventory Control with Excel
- Excel Barcode
- Excel Inventory Template
- Calculate Beginning Inventory
- Inventory Format in Excel
- Warehouse Stock Management Software
- Warehouse Stock Software
- Cloud Stock Management Software
- Warehouse Stock Management System
- Small Business Stock Management Software
- Hospital Stock Management System
- Make to Stock Examples
- Types of Stock Control Systems