


Reorder Point Formula
A reorder point is the stock level that tells you when to buy more. The reorder point formula gives each item one number. Say a pallet item sells 40 units a day. Stock takes 7 days to arrive. You need 280 units to last that long. Add a 100-unit cushion and you order at 380.
It also covers where manual work breaks down and how to automate the alerts.
Book a call
What Is the Reorder Point Formula?
The reorder point formula is reorder point = (average daily usage x lead time in days) + safety stock.
The reorder point is the stock level that triggers a new buy order. Lead time demand is the first half of the formula. It counts the units you expect to sell before the order lands.
Safety stock is the cushion on top. Order at this level and stock arrives just as the shelf runs low, with no piles of extra goods.

Why the Reorder Point Matters for Distributors
Two mistakes cost money in stock control: running out and buying too much. A stockout means a lost order and a customer who calls another supplier.
Overstock ties up cash that could buy faster-moving goods.
The IRS speaks to this in Publication 538. It says an inventory is "necessary to clearly show income when the production, purchase, or sale of merchandise is an income-producing factor."
Memory works for ten SKUs. At a few hundred, nobody recalls every lead time. A written reorder point for each item replaces guessing.
We build it for your operation, and the first look is free
If you would rather not compare products, describe how your operation already works and we build the system around it.
No build cost. You see it running on your own process first, and the monthly subscription starts only once it is live.
Book a callWhat Are the Three Parts of the Reorder Point Formula?
The formula has 3 parts: average daily usage, lead time, and safety stock. Usage and lead time multiply to give lead time demand. Safety stock is added on top.
Each part comes from your own records, as shown below.
Average Daily Usage
Average daily usage is units sold or used divided by the days in the period. The reorder point formula starts here. If you sold 1,200 units in 30 days, daily use is 40.
Pick the period that fits the item:
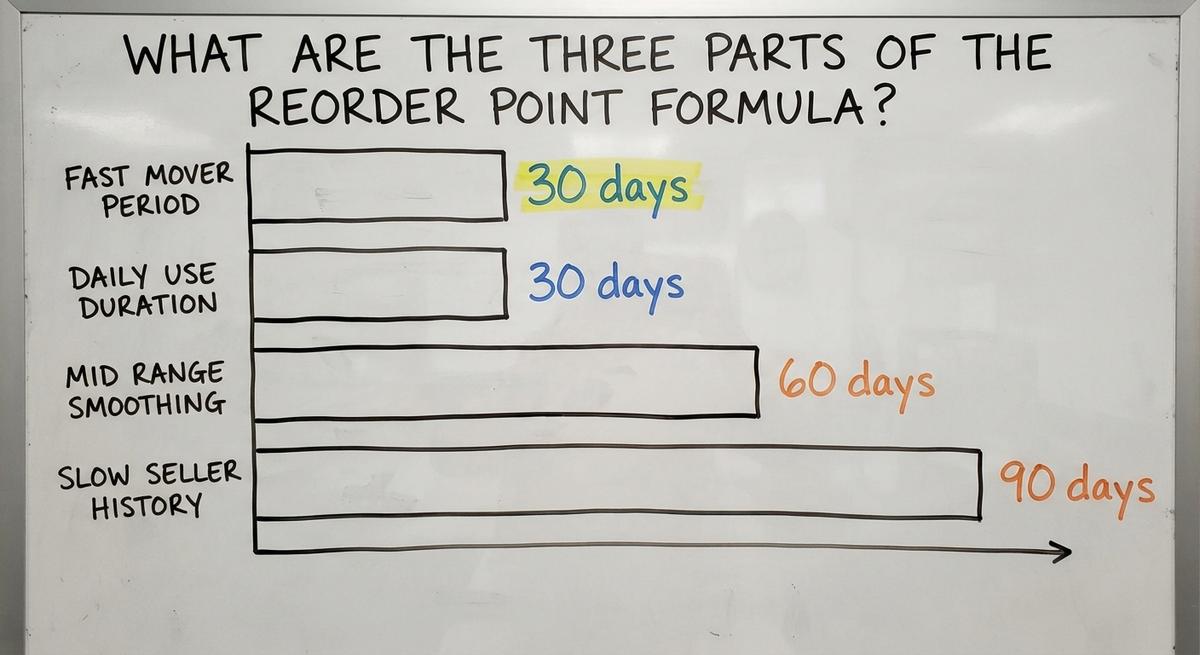
- 30 days suits fast movers whose demand shifts quickly.
- 60 days smooths out one odd week for mid-range items.
- 90 days works for slow sellers, which need more history to show a pattern.
Pull the numbers from a sales-by-item report. An accounting software report or a spreadsheet export both work.
Count only days you were open and in stock. A stockout week makes demand look lower than it was.
Lead Time
Lead time is the number of days from placing an order to having goods ready to ship. Your reorder point rests on this number. It covers three stretches: supplier processing, shipping, and your own receiving and put-away.
Look at your last five or six orders for the item. Write down the order date and the date the stock became available. Then average those gaps.
Say five orders took 8, 9, 10, 9, and 9 days. The average is 9. If the supplier says five days but your records say nine, plan on nine.
Your past orders are the only honest source for this number. Note the slowest recent order too, for the safety stock step.
Safety Stock
Safety stock is extra inventory held to cover demand spikes and late deliveries. A simple method uses your best and worst cases:
(max daily usage x max lead time) minus (average daily usage x average lead time)
Say your busiest day moved 55 units and your slowest delivery took 10 days. That gives 550.
Subtract average demand of 40 x 7 = 280. Safety stock is 270.
Items with jumpy demand or unreliable suppliers produce a bigger gap. They earn a bigger buffer. Steady items need very little.
Some people compare reorder point vs safety stock. The difference is simple: safety stock is one piece inside the reorder point.
Reorder Point Example With and Without Safety Stock
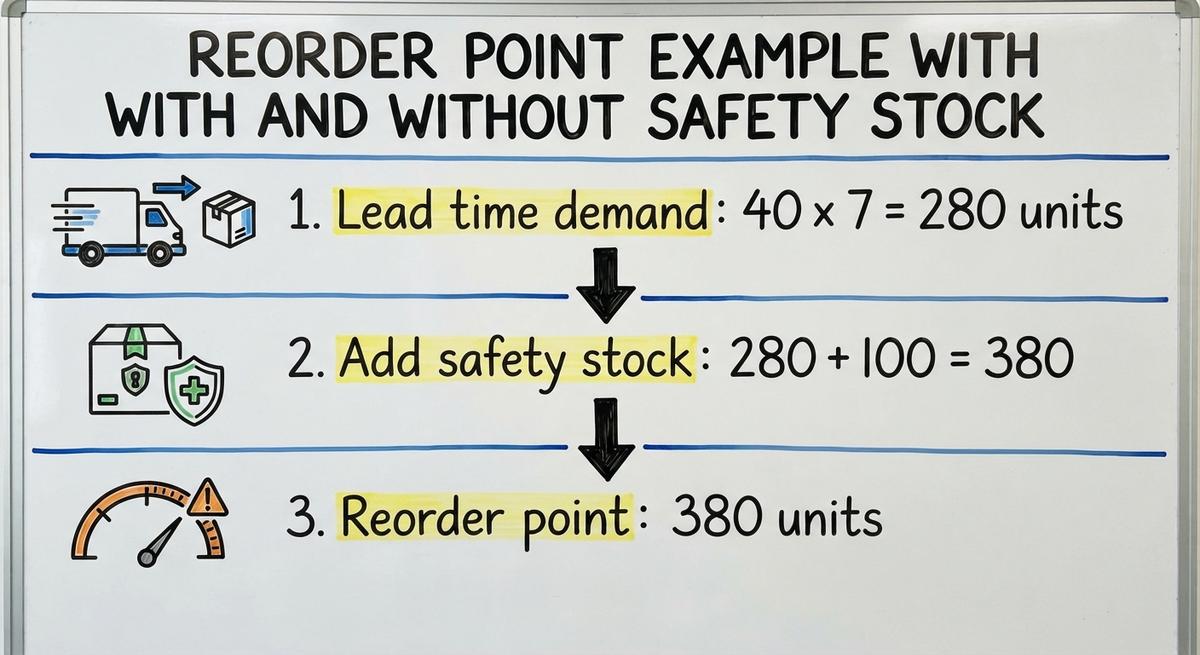
A pallet item sells 40 units a day. It has a 7-day lead time and carries 100 units of safety stock. Here is the reorder point math:
- Lead time demand: 40 x 7 = 280 units.
- Add safety stock: 280 + 100 = 380.
- Reorder point: 380 units.
When on-hand stock reaches 380, place the order. During the 7 days of waiting you use about 280. That leaves 100 when the shipment lands.
A late truck eats into that 100 instead of leaving an empty shelf.
The basic version drops the buffer: daily usage x lead time, or 280 here. That is fine for steady demand, a dependable supplier, and cheap items. If anything slips, you stock out the same day.
Not sure this is the right shape for your operation
Describe how the work runs today. We map it on a call and show you what it would look like built around that, before you spend anything.
Book a callHow Do You Set a Reorder Point for Seasonal Items?
Last year's sales are the best base for a seasonal reorder point. Use usage from the same season, not the last 90 days. Last quarter's slow sales understate what a holiday or summer rush needs.
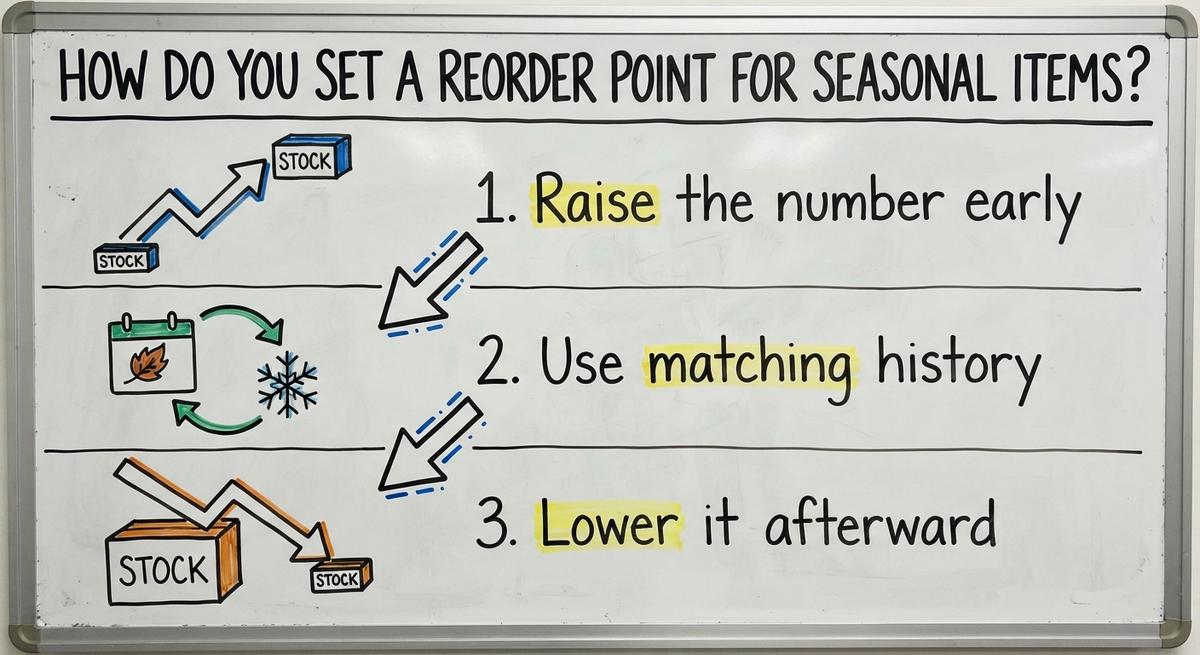
Work it in three moves:
- Raise the number early. Update it a full lead time before the busy season starts, so the bigger order is already on the way.
- Use matching history. Daily use from last July tells you more about this July than last month does.
- Lower it afterward. Once demand drops, cut the number so leftover stock does not pile up.
A reorder point that follows the calendar keeps peak stock high only when customers are buying.

Reorder Point vs. Reorder Quantity, Safety Stock, and Par Level
Reorder quantity is how much you buy per order. The reorder point says when to order.
Economic order quantity is one common method for finding the how-much. It balances ordering cost against holding cost.
Two neighboring terms cause confusion:
| Term | Details |
|---|---|
| Reorder point | What it answers: At what stock level do I order?. Example: 380 units. |
| Safety stock | What it answers: How much buffer do I hold for surprises?. Example: 100 units. |
| Par level | What it answers: What stock do I want on hand after restocking?. Example: 600 units. |
A par level is a fixed target, checked by eye on a schedule. It is enough for low-cost supplies with steady use and quick resupply.
Items with long lead times or costly stockouts deserve a true reorder point.
Common Reorder Point Mistakes
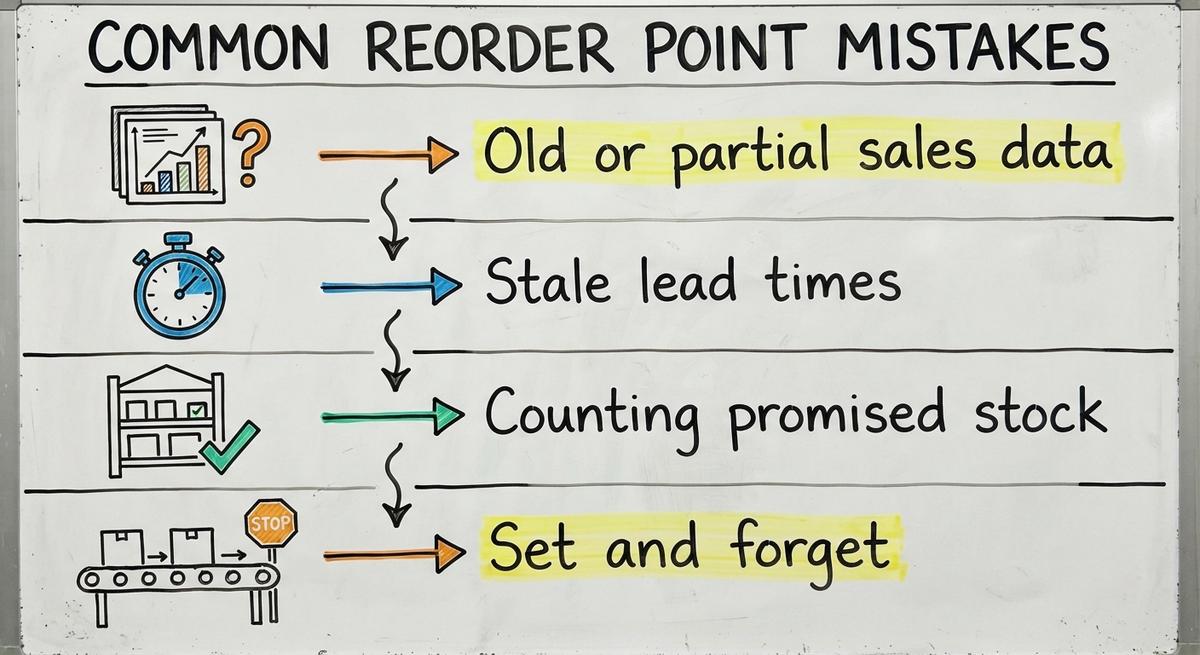
The top mistake is trusting a number that no longer matches reality. Four errors do most of the damage to a reorder point:
- Old or partial sales data. A report missing one sales channel makes demand look smaller than it is.
- Stale lead times. A supplier who slowed from five days to nine makes your formula too rosy.
- Counting promised stock. Units reserved for customer orders are not free, so compare the trigger against on-hand minus reserved.
- Set and forget. A number calculated once last year drifts further from truth every month.
Fixing the inputs matters more than refining the math.
The comparison is easier when one option is built for you
Off-the-shelf means fitting your process to the software. We do it the other way round, and the first look costs nothing.
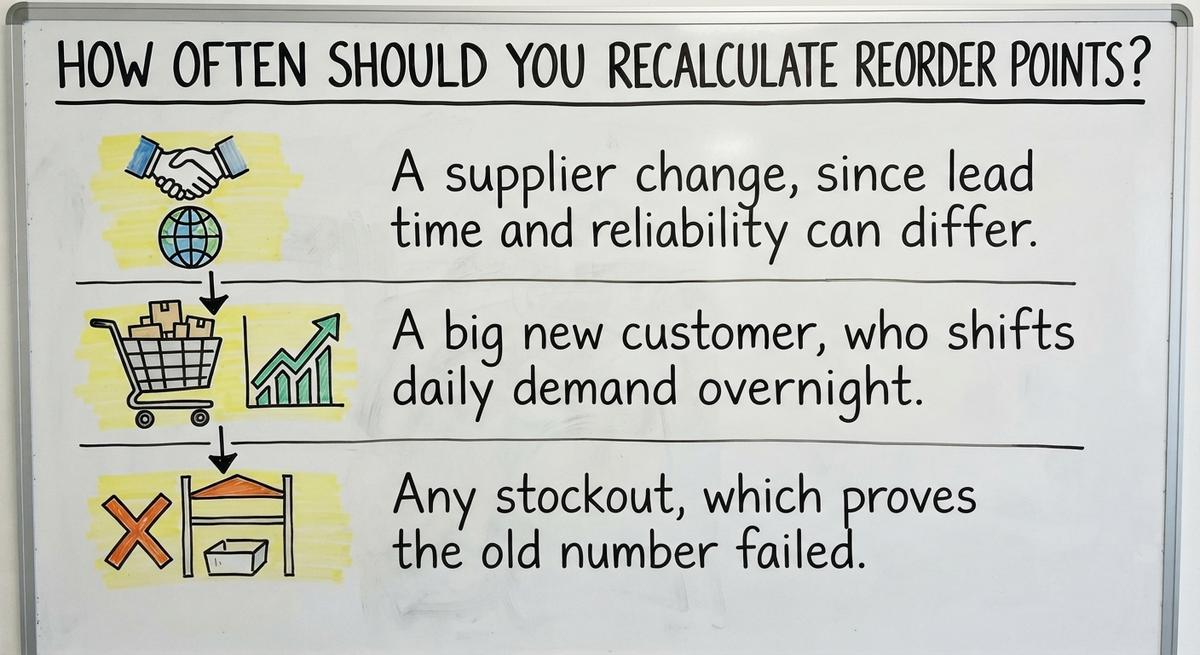
Book a callHow Often Should You Recalculate Reorder Points?
Monthly is the right pace for fast movers. Slow movers need a review each quarter. Fast items change quickly, so their numbers go stale first.
Some events call for a review at once:
- A supplier change, since lead time and reliability can differ.
- A big new customer, who shifts daily demand overnight.
- Any stockout, which proves the old number failed.
Keep a short list of items that ran out and review each one.
A stockout is the cheapest warning you will get that a reorder point needs work.


How Do You Calculate Reorder Points in a Spreadsheet or Accounting Software?
A spreadsheet is enough for a few dozen SKUs. Yes, you can calculate each reorder point there or in accounting software. Follow four steps:
- Export sales by item for your chosen period.
- Put units sold in one column and divide by days.
- Add lead time and safety stock in the next columns.
- Build the formula in a final column.
Some accounting software versions hold a reorder point field on each item. It shows a flag when stock falls below that figure. Availability depends on your version.
A basic reorder point calculator can be a single formula row copied down.
The method scales only as far as someone can keep the sheet current by hand.

See it running on your own process first
No build cost. The subscription starts once it is live and doing the job, not before.
Book a call
When Do Spreadsheets Stop Working?
The breaking point is when upkeep costs more than the sheet saves. Watch for these signs in your reorder point sheet:
- Hundreds of SKUs. Reviewing each number on schedule becomes a full-time chore.
- Several locations. Each warehouse has its own usage and lead time, multiplying the rows.
- Stale numbers. Nobody remembers when the figures were last refreshed.
- One person who knows the sheet. If they are out, purchasing guesses.
Copy-paste slips and emailed copies add errors. Two people end up on different files.
You do not need to replace everything. Automate only the manual part, the daily comparison and alert, and keep your current records.

How to Automate Reorder Alerts
An automated reorder alert is a daily check of on-hand stock against the reorder point. It notifies the buyer when stock drops to that level. Any provider or in-house script can do this.

Automating is spreading across business tasks. A 2024 report found 78% of respondents already used AI in at least one part of their business, per Pratt Solutions.
Make each alert useful:
- Show the supplier name so the buyer knows who to call.
- Include the usual order quantity to save a lookup.
- List the real lead time so the buyer sees the delivery date.
Start with your top 20 items by sales. They cause the costliest stockouts. A small test shows whether the alerts help.
Before changing your process, ask yourself:
- Which items stock out most? Those are your first candidates.
- Who owns purchasing decisions? An alert with no owner gets ignored.
- Is inventory data accurate enough to trust? Alerts built on wrong counts only automate mistakes.

Key Takeaways
The reorder point formula is (average daily usage x lead time) + safety stock. Begin with your top sellers. Use real order dates instead of supplier promises. Review the numbers on a set schedule.
When the spreadsheet falls behind, automate the alerts first. If you want help setting that up, talk to a provider about alerts that fit your current records.
Frequently asked questions
What is a reorder point?
A reorder point is the stock level at which you place a new order. It is set so replacement goods arrive before the shelf runs empty, using usage, lead time, and a buffer.
How do you calculate safety stock for the formula?
Multiply your highest daily usage by your longest lead time, then subtract average daily usage times average lead time. The difference is a simple safety stock figure for that item.
What is lead time demand?
Lead time demand is the units you expect to sell while waiting for an order to arrive. You find it by multiplying average daily usage by lead time in days.
How do I handle seasonal demand?
Use usage from the same season in a prior year, raise the reorder point one lead time before the rush, and lower it once demand falls so extra stock does not linger.
How often should I recalculate reorder points?
Review fast movers monthly and slow movers quarterly. Also recalculate right after a supplier change, a large new customer, or any stockout on that item.
5. Can I calculate reorder points in a spreadsheet or accounting software?
- Yes. Export sales by item, divide by days for daily usage, and apply the formula in columns. Some accounting software versions also store a reorder point per item, depending on the edition.
What is the difference between reorder point and reorder quantity?
Reorder point tells you when to order, based on stock level. Reorder quantity tells you how many units to buy, often found with economic order quantity.
Start with a free first look
A 30 minute call, your operation mapped, and a clear picture of what we would build. No obligation and nothing to install.
Book a callRelated guides
More on the same work.
Guides
- Reorder Point Calculator
- Reorder Period
- Apics Safety Stock Formula
- Stock Turnover Ratio Formula
- Inventory Accuracy Formula
- Shrinkage Formula in Retail
- Total Cost of Inventory Formula
- Average Days to Sell Inventory Formula
- Receiving Process Warehouse
- Inventory Audit Checklist
- Warehouse Audit Checklist
- Cycle Counting
- Inventory Shrinkage is Recorded When
- Weighted Average Inventory Valuation Method
- Fifo Method Inventory Valuation
- Dead Stock
- Cycle Count in Warehouse
- Inventory Audit
- Inventory Accuracy