


Stock Turnover Ratio Formula
The stock turnover ratio formula is cost of goods sold divided by average inventory. The result shows how many times you sold through your stock and bought it again in a period. A result of 5 means you cycled your whole inventory 5 times.
Reviewed November 2026.
It shows the math step by step. It also works through a $600,000 example you can check with a calculator.
Most pages give you the formula and stop. That skips the hard part. The ratio is only as good as the counts behind it.
Many wholesale teams keep counts on printed sheets, spreadsheet copies, and email updates. Those copies disagree. A wrong count gives a wrong ratio, and a wrong ratio leads to poor buying choices.
Here is what you will learn:
Owners and operations managers can use every step here without special training.
Book a call
What Is the Stock Turnover Ratio?
The stock turnover ratio is the number of times you sell and replace your inventory in a set period. Most people call it the inventory turnover ratio. Both names mean the same thing.
A high number means stock moves fast. A low number means stock sits on shelves. You can run it for a month, a quarter, or a year.
The ratio gives you one plain number to track over time. Watch that number and you spot trouble early.
An efficiency ratio is a measure of how well a business uses its assets. The Economic Times puts it this way: "Efficiency ratios, including inventory turnover ratio, asset turnover ratio and accounts receivable turnover ratio, offer insights into different aspects of a company's efficiency."
Turnover is the efficiency ratio that tells you the most about your shelves.
The Stock Turnover Ratio Formula
The formula divides what your goods cost you by the average value of stock on hand. Here it is in a short block:
`` Stock turnover ratio = Cost of goods sold ÷ Average inventory ``
Each part has one job:
- Cost of goods sold (COGS) is what you paid for the items you sold in the period.
- Average inventory is the typical value of stock you held in that same period.
The law also cares about these counts. IRS Publication 538 says "you must value your inventory at the beginning and end of each tax year". So you already have the numbers you need.
The formula uses two figures you already track for taxes.
We build it for your operation, and the first look is free
If you would rather not compare products, describe how your operation already works and we build the system around it.
No build cost. You see it running on your own process first, and the monthly subscription starts only once it is live.
Book a callHow Do You Find Cost of Goods Sold?
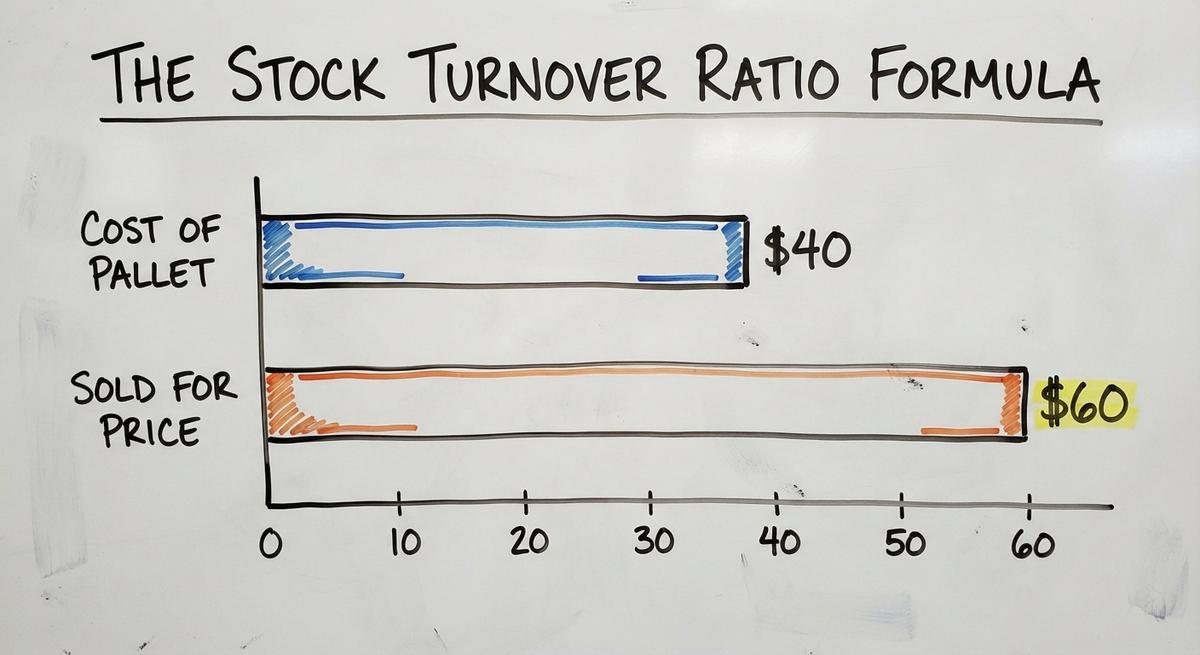
You find COGS by adding up what you paid for the items you sold, not what customers paid you. Use cost, never sales price. A pallet that cost $40 and sold for $60 adds $40.
In most accounting packages, open the profit and loss report. Look for the line with that name. It sits between income and gross profit.
Set the report dates first. If you use a 12-month inventory figure, run the report for the same 12 months. A date mismatch breaks the ratio.
Your COGS figure must cover the same dates as your stock figure.
How to Calculate Average Inventory
Average inventory is your beginning balance plus your ending balance, divided by 2. The beginning balance is the value on the first day of the period. The ending balance is the value on the last day.
`` Average inventory = (Beginning inventory + Ending inventory) ÷ 2 ``
A single snapshot can mislead you. Stock may be low the day before a big delivery. It may be high the day after. Two points smooth out some of that swing.
Seasonal firms can do better. Add the count from each month-end. Then divide by the number of counts. A 12-count average beats a 2-count average when sales spike in the holidays.
More count points give a truer average.
A Worked Example With Real Numbers
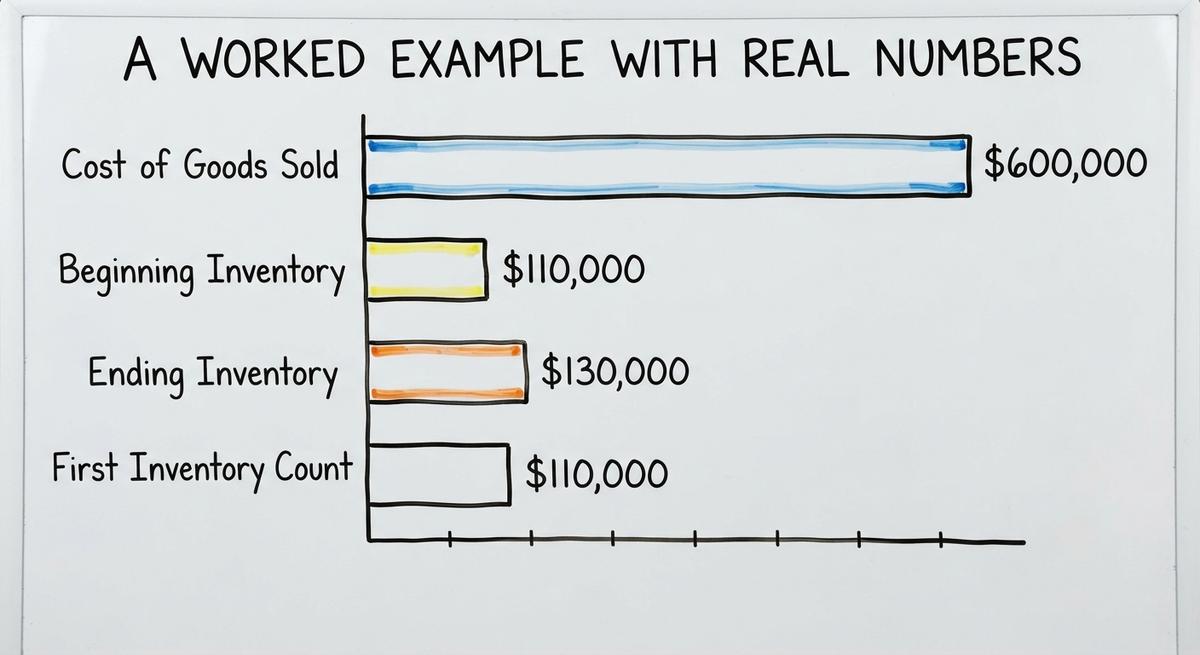
A small wholesale distributor shows how the stock turnover ratio formula works in practice. The numbers below are made up for the example. You can follow each step with a calculator.
The distributor has these figures for one year:
- COGS: $600,000
- Beginning inventory: $110,000
- Ending inventory: $130,000
Now work through it:
- Add the two counts: $110,000 + $130,000 = $240,000.
- Divide by 2: $240,000 ÷ 2 = $120,000. That is the average.
- Divide COGS by that average: $600,000 ÷ $120,000 = 5.
The ratio is 5. The distributor cycled its shelves 5 times in the year.
A ratio of 5 means every dollar of stock was sold and bought again 5 times.
A Second Example With a Low Result
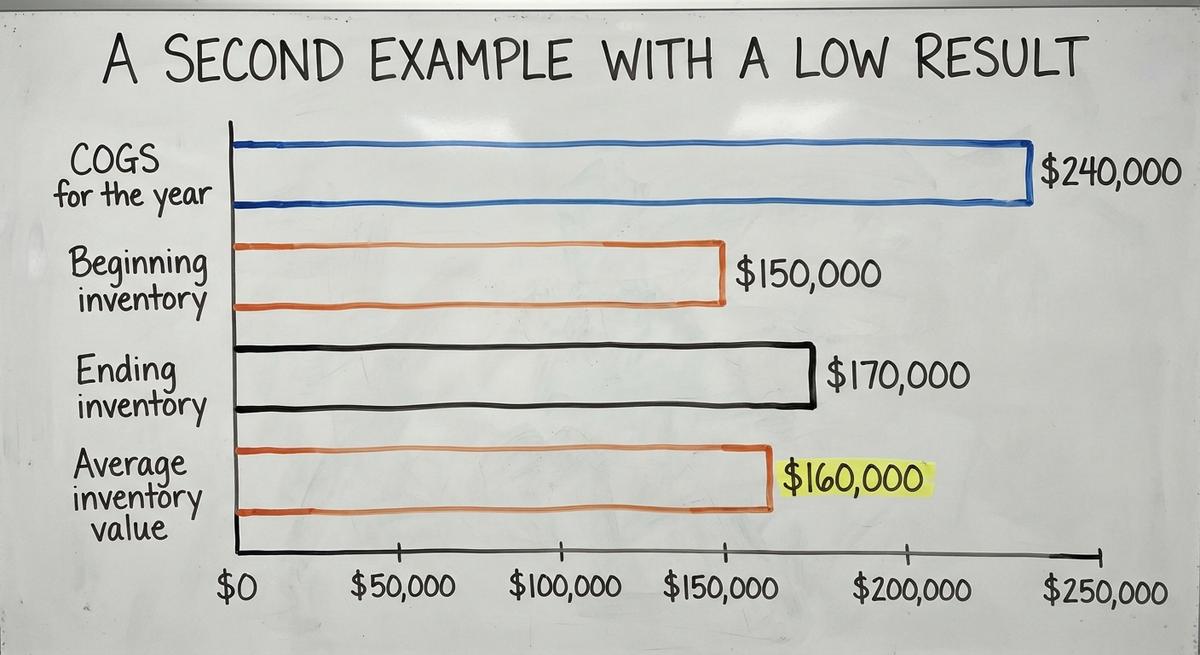
A slower business shows what a weak result looks like. Take a specialty parts seller. The figures are made up, as before.
- COGS for the year: $240,000
- Beginning inventory: $150,000
- Ending inventory: $170,000
The average is ($150,000 + $170,000) ÷ 2 = $160,000. Then $240,000 ÷ $160,000 = 1.5.
The seller turned its stock only 1.5 times. Its stock lasts 365 ÷ 1.5 = about 243 days. That is eight months of goods on the shelf.
Compare that to the first distributor at 73 days. The parts seller holds more than three times as much supply for each dollar sold.
A result of 1.5 is a prompt to check what sits unsold.
Not sure this is the right shape for your operation
Describe how the work runs today. We map it on a call and show you what it would look like built around that, before you spend anything.
Book a callHow to Turn the Ratio Into Days on Hand
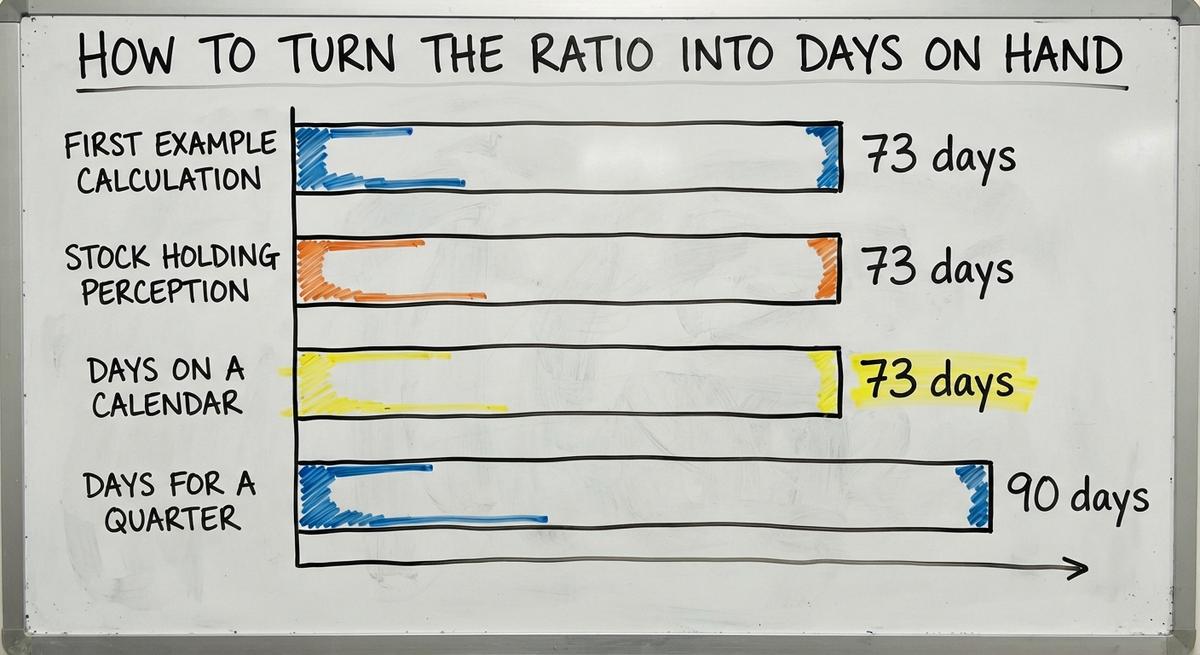
Days inventory on hand is the number of days your stock lasts at the current sales pace. The math is days in the period divided by the turnover ratio. For the first example: 365 ÷ 5 = 73 days.
Days are easier for staff to picture. Telling a buyer "we hold 73 days of stock" lands faster than "we turn 5 times." Everyone can feel 73 days on a calendar.
For a quarter, use 90 days. For a month, use 30. Match the day count to the period of the ratio.
A lower day count means faster sales. A higher one means more cash sits on shelves.
A day count turns an abstract ratio into a number the whole team can act on.

Other Ways to Write the Formula
A quick variant divides sales by average inventory. Some people use it because sales figures are easy to find. The catch is that sales include your markup. Inventory is valued at cost. The two sides do not match.
COGS is more exact. It compares cost to cost. Use it when you can.
Pick one version and use it every time. A trend line only works if each point uses the same math.
You can also pick the period:
- Annual results smooth out busy and slow months.
- Quarterly results show shifts sooner. Multiply by 4 to compare with a yearly figure.
Here is a quarterly case. COGS is $150,000 and average stock is $100,000. The quarterly result is 1.5. Multiply by 4 and the yearly pace is 6.
One method, used the same way each time, makes your trend honest.

What Is a Good Stock Turnover Ratio?
There is no single good stock turnover ratio. The right number depends on what you sell. One inventory guide says "A good inventory turnover ratio is typically between 4 and 8 for most industries." Treat that as a rough range, not a rule.
Another guide narrows it. Unleashed says "An inventory turnover ratio of between 4-6 is usually a good indicator that your sales and inventory orders are balanced."
Fast movers and short-life goods turn quickly. Bulky or specialty goods turn slowly. A food wholesaler and a pump supplier will never match.
Your own trend is the best yardstick you have.
How Do Real Companies Compare?
Two big retailers show how much rivals can differ. The Corporate Finance Institute compared Walmart and Target. Walmart sells its inventory 8.26 times in a year. Target sells its stock 5.54 times.
Both firms sell in the same retail industry. Yet one moves goods about 49% faster. Neither number is wrong. Each reflects a different mix of products and buying habits.
Use that lesson on your own shelves. Compare yourself to a close peer, not to a different trade.
For outside data, check your trade association. The US Census Bureau also publishes monthly wholesale inventories and sales. Do not trust a made-up benchmark from a random page.
Peer gaps of 3 points or more are normal inside one industry.
The comparison is easier when one option is built for you
Off-the-shelf means fitting your process to the software. We do it the other way round, and the first look costs nothing.
Book a callWhat Does a High Stock Turnover Ratio Tell You?
A high result tells you that goods leave your shelves fast. That is good news when sales are strong and stock is lean. Cash comes back sooner.
Watch for the risks:
- Empty shelves cost you sales when a customer needs an item today.
- Rush orders from suppliers raise your freight cost.
- You may be buying too little, not selling well.
A high number is only good when you still fill every order.
What Does a Low Stock Turnover Ratio Tell You?
A low result tells you that stock sits too long. Cash is tied up on shelves. A low figure can also point to weak demand or poor buying.
The costs add up:
- Storage space costs money every month.
- Old stock can go bad, go out of style, or break.
- Dead stock, items that will never sell, must be written off.
A low ratio is a warning that cash is stuck in goods nobody wants.

Common Mistakes When Using the Formula
Four mistakes cause most bad results. Each one is easy to avoid once you know it.
- Mixed periods. Using 12 months of cost with a 3-month stock count gives a false ratio.
- Sales instead of cost. Sales include markup, so the result looks better than it is.
- One year-end count. A big buy just before year end inflates the average and drops the ratio.
- Old counts. Stock figures from last month do not match this month's cost.
Check each of these before you share a result with your team. A ratio built on mismatched inputs sends the wrong signal.
Most wrong ratios come from the inputs, not the math.

Why Spreadsheet Counts Throw Off the Ratio
Spreadsheet counts throw off the ratio when more than one version of the count exists. A printed sheet goes to the warehouse. An Excel copy sits on the owner's laptop. An email update fixes 3 items. Now 3 numbers claim to be the truth.
Your average depends on those counts. Bad input gives a bad ratio. No formula can fix it.
Keep one source of truth for stock. That means one place where every receipt, sale, and adjustment lands. Everyone reads from it. Nobody keeps a private copy.
If your ratio looks wrong, check the counts first. Look for duplicate files, late updates, and typos.
The ratio is only as honest as the count behind it.

How Do You Set Up the Ratio in a Spreadsheet?
You can build the ratio in a spreadsheet in five short steps. Keep one tab for inputs and one for results.
- Put the period start and end dates in two cells.
- Enter beginning and ending stock values in their own cells.
- Pull COGS for those exact dates from your accounting report.
- Write the average and the ratio as formulas, not typed numbers.
- Add a cell that divides the days in the period by the ratio.
Lock the input cells so nobody types over them by mistake. Save a dated copy each month. That gives you a trail of results to chart.
Formulas in cells keep the math the same every month.

How to Calculate Turnover by Product or Category
A single company-wide number hides slow items. Fast sellers pull the average up. Slow ones hide behind them. Break the figure out to see the truth.
Split it by one of these:
- Product line, to see which families move
- Supplier, to see whose goods linger
- Warehouse, to see which location overstocks
Start small. Pull the top 20 items by dollar value. Those items hold most of your cash. Run the same formula on each one, with its own COGS and its own average count.
Sort the list from slowest to fastest. The bottom of that list is where you act first.
A company-wide number tells you there is a problem, and the breakout shows you where.
How to Improve a Low Stock Turnover Ratio
To lift a low stock turnover ratio, buy less of what sells slowly and sell off what is stuck. The NIST Manufacturing Extension Partnership offers vendor-neutral guidance on supply chain and inventory process if you want a deeper read.
Try these steps:
- Set reorder points from real sales. Base each trigger on the last 90 days of orders, not a guess.
- Clear slow stock. Offer a discount or bundle slow items with fast ones.
- Order smaller amounts more often. Do this where your suppliers allow it.
- Review supplier lead times. Long waits push you to over-order as a cushion.
Pick one step this week. Track the ratio for 3 months to see the effect.
Smaller, smarter orders free cash faster than any markdown sale.
See it running on your own process first
No build cost. The subscription starts once it is live and doing the job, not before.
Book a callHow Do You Fix a Stock Turnover Ratio That Is Too High?
You fix a result that is too high by adding enough stock to meet demand. A high figure feels like a win, but lost orders hide inside it.
Use these steps:
- Add safety stock, a small buffer, for your best sellers.
- Log every stockout and every lost order with the item and the dollar value.
- Weigh the cash you save against the sales you miss.
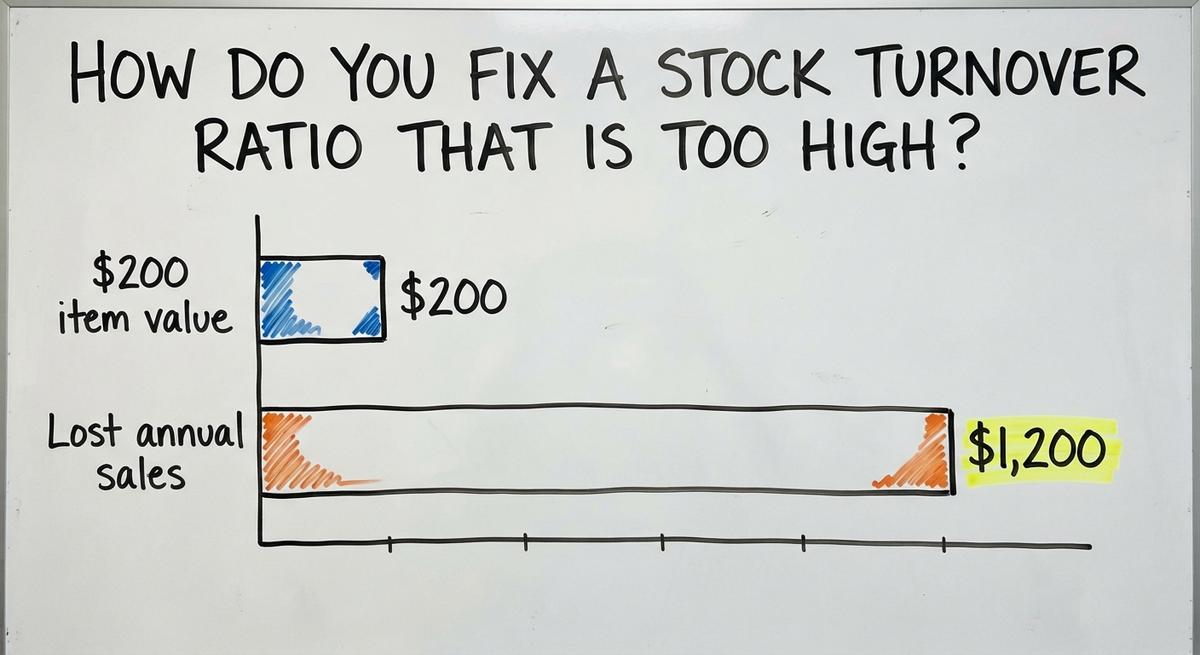
If a $200 item is out of stock 6 times a year, you lose $1,200 in sales. Compare that to the price of holding a few extra units.
The right balance frees cash and still ships every order.

How Often Should You Check Your Ratio?
Check your stock turnover ratio monthly if you run an active distribution business. Check it at least once a quarter if goods move slowly. Monthly checks catch trouble in 30 days, not 12 months.
Track the result as a trend line. One number tells you little. Six numbers in a row tell a story.
Set a simple habit. Meet with your operations manager on the same day each month. Review the ratio, the day count, and the 5 slowest items. Write down one action.
A short monthly review beats a long yearly one.

When to Move Beyond Manual Tracking
Manual tracking has hit its limit when you see these signs:
- Stock counts take hours each month.
- Two reports show two different numbers.
- Nobody on the team trusts the report.
The cost is real. Say 3 people spend 6 hours a week on counts at $22 an hour. That is $20,592 a year. The Bureau of Labor Statistics lists pay data for stock clerks if you want your own figure.
Your accounting package can stay as it is. Automate only the manual stock steps. When you judge any provider, ask for a small, fixed first step rather than a big move.
Fix the counts first, and the ratio starts to mean something.

Key Takeaways
The stock turnover ratio formula is COGS divided by average inventory. Use the same period and the same method every time. Use cost, not sales.
Clean counts come first. Keep one source of truth for stock. Then the ratio means something, and the day count makes it easy to share.
Start this week. Pull your COGS, find your average, and write down your first result. Then check it again next month.
Frequently asked questions
How do I calculate stock turnover?
Divide cost of goods sold by average inventory for the same period. Average inventory is beginning stock plus ending stock, divided by 2. With $600,000 in cost and $120,000 average stock, you get 5.
What is the formula for turnover rate?
The turnover rate for stock is cost of goods sold divided by average inventory. A result of 5 means you sold and replaced your stock 5 times. Divide 365 by that number to get days.
How to calculate inventory turnover ratio in Excel?
Put cost of goods sold in one cell and both counts in two others. Then divide cost by the average of the counts, for example B2 divided by the sum of B3 and B4, over 2.
Is 3 a good inventory turnover ratio?
A ratio of 3 is good for some goods and weak for others. It means 122 days on hand. Bulky or specialty goods can run that slow. Compare it to your own past results.
Should I use sales or cost of goods sold?
Use cost of goods sold. Inventory is valued at cost, so cost matches cost. Sales include your markup and make the ratio look higher than it is.
Why does my ratio look wrong?
Wrong results come from bad inputs. Check for mixed time periods, sales used in place of cost, a year-end count after a large buy, and stock counts kept in conflicting files.
Start with a free first look
A 30 minute call, your operation mapped, and a clear picture of what we would build. No obligation and nothing to install.
Book a callRelated guides
More on the same work.
Guides
- Inventory Accuracy Formula
- Replenish Stock
- Average Days to Sell Inventory Formula
- Total Cost of Inventory Formula
- Warehouse Stock Management Software
- Warehouse Stock Software
- Cloud Stock Management Software
- Warehouse Stock Management System
- Small Business Stock Management Software
- Hospital Stock Management System
- Make to Stock Examples
- Types of Stock Control Systems
- Stock Software
- Low Stock Alert
- Procedure for Stock Control
Common questions
- How to Calculate Safety Stock in Excel
- Reorder Point vs Safety Stock
- How to Stock Control
- How to Calculate Cycle Stock
- What is Stock Taking in Inventory Management
- How to Maintain Stock Levels
- What is Fluctuation Stock in Inventory Management
- How to Prevent Stock Discrepancies
- Why is Stock Rotation Important in Relation to Food Safety