


Apics Safety Stock Formula
The APICS safety stock formula is Z x standard deviation of demand x square root of lead time. ASCM still teaches this method.
Z is a score for your service level.
A 95% service level, 40 units of weekly swing and a 4 week lead time give 132 units.
Book a call
What Is the APICS Safety Stock Formula?
The APICS safety stock formula is the standard statistical way to size a buffer.
Safety stock = Z x σd x √LT
The formula turns two facts into one number. One is how much demand swings. The other is how long a refill takes.
APICS is now part of ASCM, the supply chain association. Many buyers still say APICS.
Both names point to the same method.
Safety stock itself is extra stock you hold to cover surprises. A bigger swing or a longer wait means a bigger buffer.
One running item lets you check every step.

What Does Safety Stock Mean in Plain Words?
Safety stock is a cushion for late orders and surprise demand. Think of a spare tire for your shelves. You hope to never use it. You are glad it is there.
Safety stock is not the stock you plan to sell. Cycle stock covers normal sales. Safety stock covers the gap when normal fails.
The tax office counts both kinds. IRS Publication 538 says "you must value your inventory at the beginning and end of each tax year."
So the buffer is real money on your books, not a free extra.
We build it for your operation, and the first look is free
If you would rather not compare products, describe how your operation already works and we build the system around it.
No build cost. You see it running on your own process first, and the monthly subscription starts only once it is live.
Book a call
What Is the Basic Safety Stock Formula?
The basic safety stock formula is Safety stock = Z x σd x √LT. It uses demand variation only.
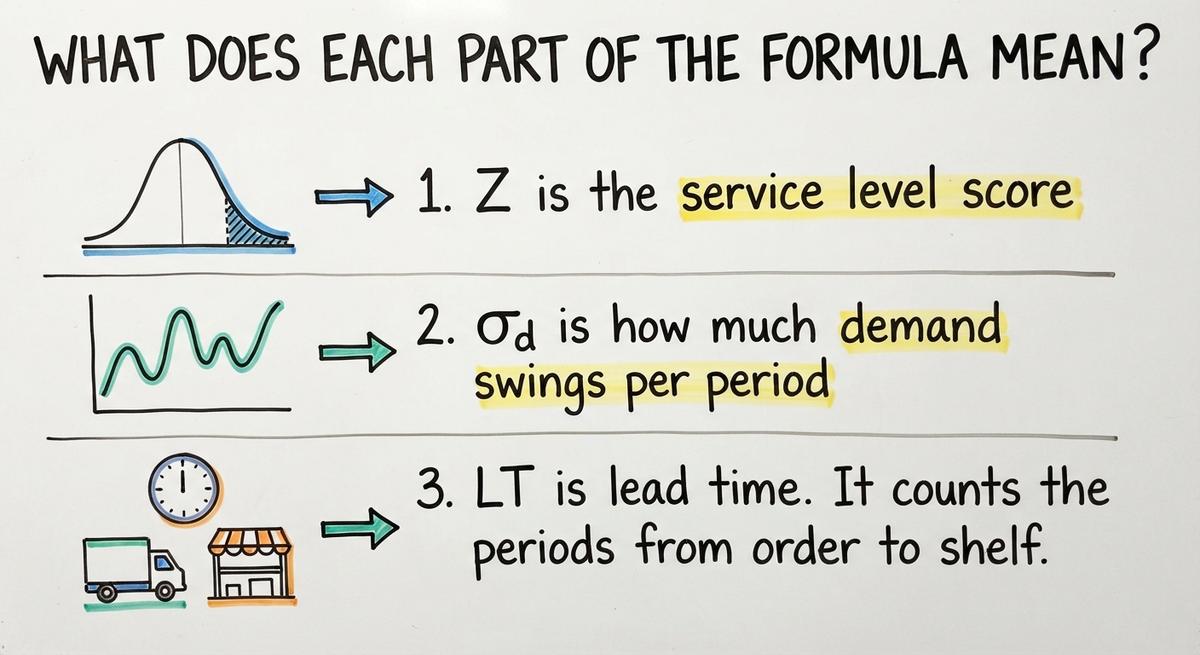
Z is the service level score. σd is the spread of demand per period. LT is lead time in those same periods.
This version assumes lead time stays steady. Your supplier ships in 4 weeks, every time.
What Does Each Part of the Formula Mean?
The formula has 3 parts, and each one is a single number you can look up. Match the units before you multiply.
- Z is the service level score. A higher score means fewer stockouts and a bigger buffer.
- σd is how much demand swings per period. A steady item has a small number. A jumpy item has a large one.
- LT is lead time. It counts the periods from order to shelf.
The periods must match. If σd is per week, LT is in weeks. If σd is per day, LT is in days.
Mixing them is the most common error. A weekly σd with a lead time of 28 days gives a wrong answer by a wide margin.
Every part must speak the same time unit.
How Do You Pick the Z Value for Your Service Level?
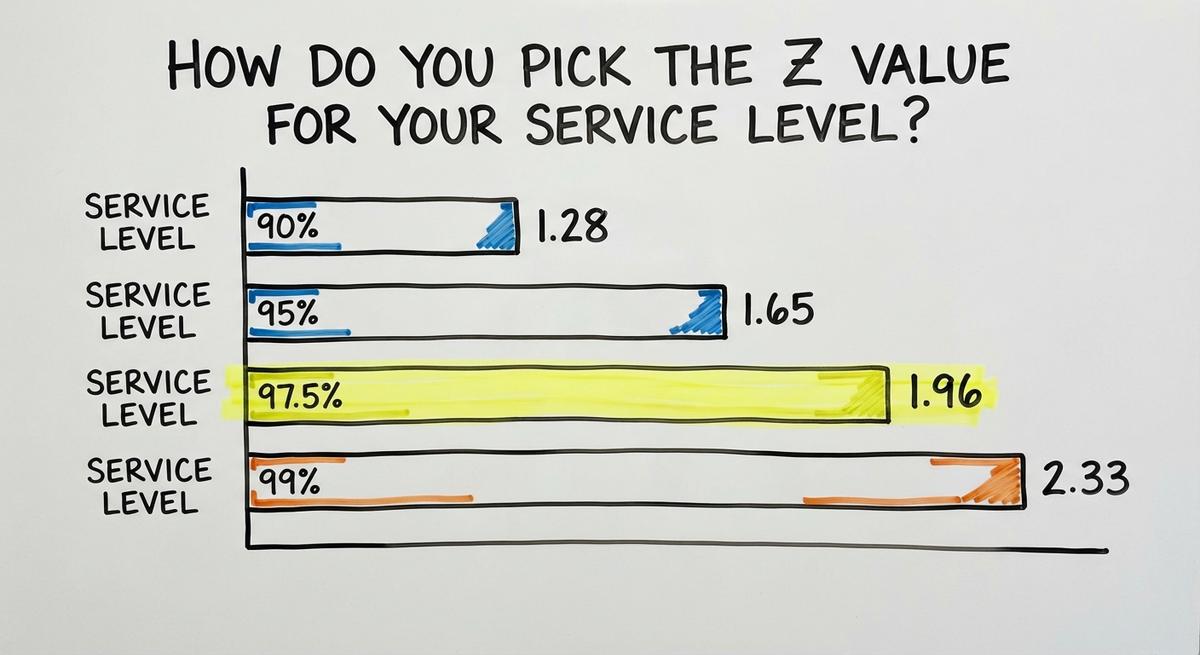
Service level is the share of order cycles with no stockout. A Z score turns that share into a number you can multiply. Pick yours from the table.
| Service level | Z score |
|---|---|
| 90% | 1.28 |
| 95% | 1.65 |
| 97.5% | 1.96 |
| 99% | 2.33 |
A higher Z means a bigger buffer for the same item.
What Does a Higher Service Level Cost?
Higher service levels tie up more cash. Take our item with σd of 40 and LT of 4 weeks.
At 90%, safety stock is 40 x 1.28 x 2, or 102 units. At 99%, it is 40 x 2.33 x 2, or 186 units.
The last 9 points of service cost 84 extra units.
Should You Choose by Item or by Warehouse?
Pick a service level for each item rather than for the whole warehouse. A best seller that drives repeat orders earns 99%. A slow filler item may need only 90%.
One number for all stock overstocks cheap items and starves key ones. Set Z by how much a stockout hurts.
Let the buffer follow the price of running out.
Not sure this is the right shape for your operation
Describe how the work runs today. We map it on a call and show you what it would look like built around that, before you spend anything.
Book a callHow Do You Find the Standard Deviation of Demand?
The standard deviation of demand is a number that shows how far weekly sales stray from the average. A spreadsheet computes it in one step. You only need clean sales history for one item.
How Do You Pull and Clean the History?
Export weekly or daily sales for one item. Use at least 12 periods when you can.
Fewer points give a shaky answer. The math needs enough data to measure a pattern.
Remove one-time spikes, such as a single huge order. Leave a note beside the cell saying what you removed and why. Anyone who checks the sheet later can then follow your choices.
How Do You Run the Calculation?
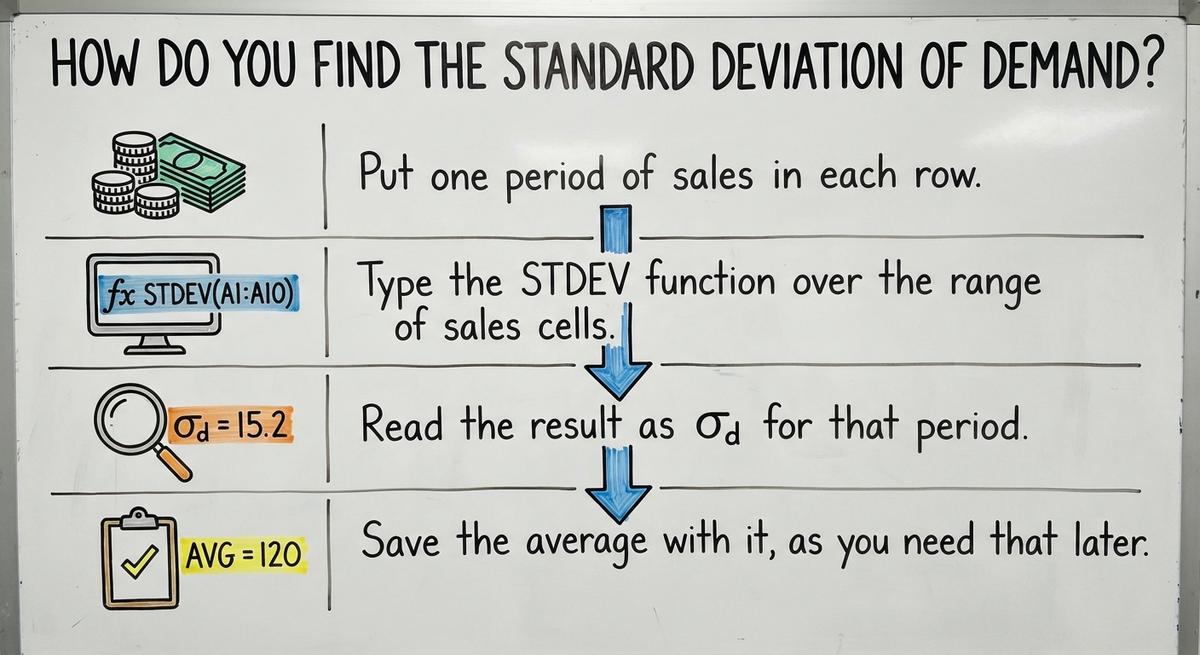
Follow these steps in any spreadsheet:
- Put one period of sales in each row.
- Type the STDEV function over the range of sales cells.
- Read the result as σd for that period.
- Save the average with it, as you need that later.
For a full walk-through, read how to calculate safety stock in excel. The same steps work in any sheet.
What Does a Safety Stock Example Look Like With Real Numbers?
The safety stock example below uses one item with 3 inputs. Weekly demand swings by 40 units. Lead time is 4 weeks. The service level is 95%, so Z is 1.65.

Step One: Find the Buffer
Start with the buffer. Multiply σd, then Z, then the square root of LT. Here that is 40 units, 1.65, and 4 weeks.
The square root of 4 is 2. So safety stock is 40 x 1.65 x 2, which equals 132 units.
Assume each unit costs $25. The buffer holds $3,300 of stock.
Step Two: Add It to the Reorder Point
The reorder point is the stock level that triggers a new order. Reorder point = average demand during lead time + safety stock.
Say average demand is 200 units a week. Over 4 weeks that is 800 units. Add 132 and the trigger is 932 units.
When on-hand stock falls to 932, place the order. Safety stock covers the swing after that point.
People search for reorder point vs safety stock because the two get mixed up. One is a trigger. The other is a buffer inside it.
What Formula Fits When Lead Time Varies?
The formula for lead time variability is Safety stock = Z x √(LT x σd² + d² x σLT²). Use it when suppliers are often late. The basic version misses that risk.
What Are the Added Terms?
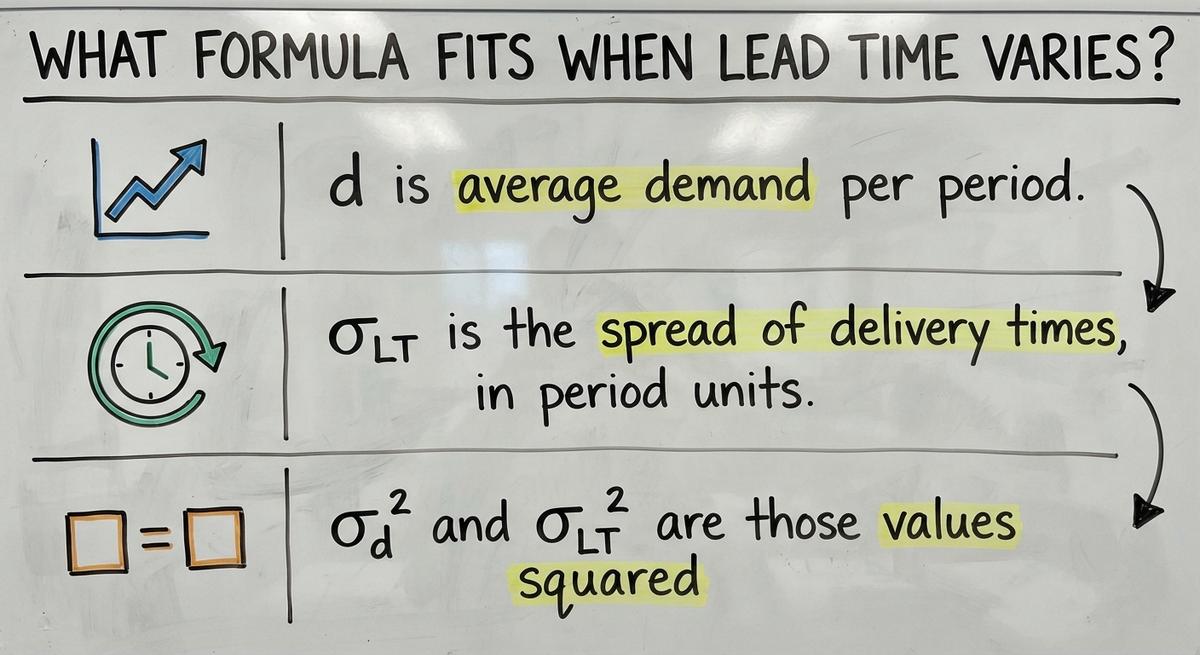
The fuller safety stock formula adds three terms to the basic version. Read the definitions before you plug in numbers. Keep every term in the same period units as your demand data, such as weeks.
- d is average demand per period.
- σLT is the spread of delivery times, in period units.
- σd² and σLT² are those values squared.
How Do You Run It on the Example?
Say σLT is 1 week and d is 200. First, 4 x 40² is 6,400. Next, 200² x 1² is 40,000. The sum is 46,400. Its root is about 215.
Multiply by 1.65 and you get 355 units. That is more than 2.5 times the 132 units from the basic version.
A late supplier adds far more buffer than shaky demand does.
The comparison is easier when one option is built for you
Off-the-shelf means fitting your process to the software. We do it the other way round, and the first look costs nothing.
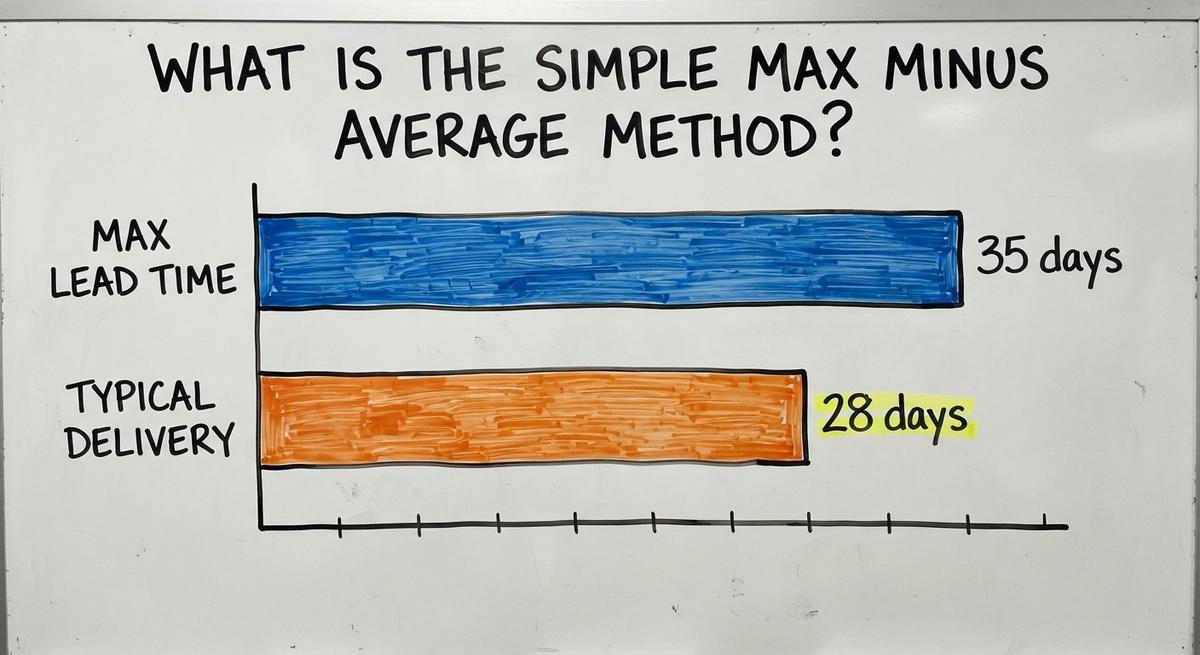
Book a callWhat Is the Simple Max Minus Average Method?
The simple method is Safety stock = (max daily use x max lead time) - (average daily use x average lead time). It needs no σd. A small team can finish it in a minute.
Take our item. Max daily use is 40 units. Max lead time is 35 days. That gives 1,400.
Average daily use is 29 and typical delivery takes 28 days. That gives 812. The buffer is 588 units.
Compare 588 with 132 from the statistical method. The simple method is less precise and overstocks. It stacks the worst demand on the worst delay.
Use it when you have under 12 periods of data. Switch once the history grows.

Which Items Need Safety Stock Most?
Safety stock pays off most on fast movers and on items with long or shaky lead times. A stockout on these costs the most sales. A stockout on a slow item costs little.
Use ABC ranking to focus. Rank items by yearly sales value. A items are the top few and carry most of the dollars. Run the full formula on A items first.
- Fast movers sell daily, so a gap shows up at once.
- Long lead items leave you exposed for weeks.
- Slow, cheap, easy to replace items need no buffer. Reorder them when a customer asks.
Spend your math on the items that carry your sales.
What Does Safety Stock Cost You?
Safety stock has a carrying cost, and that cost is real money. The buffer needs cash, shelf space and care. Stock can be stolen, spoil or go out of date.
What Is the Cost of Holding?
Assume a 25% yearly carrying cost. The $3,300 buffer from our example costs $825 a year.
Food and dated goods carry more risk. Learn why stock rotation matters for food safety before you stack a big buffer of them.
The stock turnover ratio formula shows how fast stock moves. Slow turnover plus a big buffer is a warning sign.
What Is the Cost of Running Out?
A stockout costs the lost sale plus the customer who leaves. Say one missed order costs $1,000 in sales and a lost buyer. Then a $825 buffer is cheap.
If the item sells $50 a year, it is not cheap.
Weigh holding costs against stockout costs for each item. Set your service level where the two meet.

Common Mistakes With the Safety Stock Formula
Five mistakes cause most bad safety stock numbers. Each one is easy to fix once you spot it.
- Mixing time units gives a wrong answer. Use days with days and weeks with weeks.
- Using too little history makes σd unstable. Gather 12 periods or more.
- Treating the number as fixed leaves old math in place. Demand and suppliers change.
- Using one service level for every item overstocks cheap goods. Set a Z for each item.
- Ignoring supplier lateness hides risk. Use the varying lead time version when deliveries slip.
A short review of your inputs catches all 5.
See it running on your own process first
No build cost. The subscription starts once it is live and doing the job, not before.
Book a callWhen Does the Formula Not Fit Well?
The formula assumes demand follows a bell curve. Some items break that rule. Three cases need a closer look.

What About Intermittent or Lumpy Demand?
An item that sells 0 units for 6 weeks and then 300 in one order has lumpy demand. The spread is a poor guide for such an item.
Do not trust the result on its own.
Review these items by hand and ask the big buyers about plans. What they tell you about coming orders beats the history.
What About New Products With No History?
Set a small buffer at first. Then update the figures once the new item has built up 12 periods of its own sales.
A new item has no sales to measure, so σd cannot be found yet. Use a similar item as a stand-in. Borrow its demand pattern as a starting point.
What About Seasonal Items?
A season has its own pattern. Compute σd from past seasons only. Do not mix peak weeks with off weeks. Blending them gives a number that fits neither period well.
For lumpy, new and seasonal items, judgment beats a formula fed with bad data.
How Often Should You Recalculate Safety Stock?
Recalculate safety stock every quarter for most items and every month for fast movers. A stale number drifts away from real demand within a few months.
Run it again at once after a supplier change or a demand shift. A new vendor changes lead time. A new big customer changes σd.
Log the date and the inputs each time. Then you can see why a number moved.
A dated log turns a guess into a record.

Why Do Spreadsheets Make This Hard to Keep Current?
Spreadsheets break down on safety stock because the data moves faster than the file. Sales exports from the accounting package get pasted in by hand. That takes time and invites slips.
The US Bureau of Labor Statistics tracks pay for inventory clerks. Hours spent on copy and paste carry a real cost.
- Old numbers sit in a sheet that nobody refreshed.
- Broken formulas appear when someone sorts one column.
- Copies in email split into versions that disagree.
- Dead ends arise when results never reach the person who places orders.
The math is easy. Keeping inputs fresh is the hard part.
How to Keep Safety Stock Numbers Up to Date
Fresh safety stock numbers come from a clean process, not a bigger tool. The NIST Manufacturing Extension Partnership offers vendor-neutral guidance on supply chain process. These 3 habits work with any tool or provider.
Keep One Clean Item List
Hold lead times, service levels and costs for each item in one place. Every calculation then draws on the same figures. Fix errors there and nowhere else.
When a number changes, update it once. Later calculations use the corrected value instead of an old copy kept elsewhere.
Pull Sales on a Set Schedule
Pick a day each month to export sales. Run the same steps every time. Results are then built the same way and can be trusted.
Compare each result with the last. A large jump from one month to the next is a sign to check the data before you change any buffer.
Show the Trigger Where Buyers Work
Put the reorder point on the screen or sheet the buyer already uses. A number buried in a file never triggers an order.
The US Census Bureau publishes the inventories-to-sales ratio for wholesale firms. Use it as a rough yardstick for your own stock.

What Is the Safety Stock Formula Checklist?
The safety stock formula takes 6 steps. Follow them in order for each item.
- Pick one item, starting with your top A item.
- Gather 12 or more periods of sales history.
- Set the service level and look up Z.
- Calculate Z x σd x √LT, or use the varying lead time version.
- Add the result to average lead time demand for the reorder point.
- Review on a set date and log the inputs.
Start this week with your top 10 items, and write down each reorder point.
Frequently asked questions
What is the calculation for safety stock?
Safety stock equals Z times the standard deviation of demand times the square root of lead time. With Z of 1.65, a deviation of 40 and 4 weeks of lead time, the result is 132 units.
What is a good service level?
No one service level fits all. Most firms pick 95% for core items, 99% for critical ones and 90% for low-value items. Choose by what a missed sale costs you.
Can I use the safety stock formula in a spreadsheet?
Yes. Put weekly sales in a column, use the standard deviation function on that range, then multiply by Z and the square root of lead time. Any basic spreadsheet handles it.
How is safety stock different from reorder point?
Safety stock is the extra buffer. The reorder point is the stock level that triggers an order. The reorder point equals lead time demand plus the safety stock buffer.
Is APICS the same as ASCM?
APICS is the old name for what is now ASCM. The two groups joined in 2019. Books and courses may carry either name, but the safety stock method inside is the same.
What is ERP safety stock?
ERP safety stock is a buffer quantity field kept on an item record in that large planning system. The planner enters the number or lets a rule fill it. The math behind it is the same.
Does safety stock change in peak season?
Safety stock changes in peak season because demand swings more. Use peak-only history for σd. The Fulfillment-Box peak season guide notes that online shoppers spent "$222.1 billion in November 2023."
What if I have no sales history?
With no history, use the max minus average method or borrow data from a similar item. Set a modest buffer. Swap in the full formula after you log 12 periods of real sales.
Start with a free first look
A 30 minute call, your operation mapped, and a clear picture of what we would build. No obligation and nothing to install.
Book a callRelated guides
More on the same work.
Guides
- Stock Turnover Ratio Formula
- Inventory Accuracy Formula
- Reorder Point Formula
- Shrinkage Formula in Retail
- Dead Stock
- Stock Shrinkage
- Replenish Stock
- Total Cost of Inventory Formula
- Average Days to Sell Inventory Formula
- Retail Stock Management Software
- Medical Stock Management System
- Stock and Inventory Simple
- Stock Software
Common questions
- How to Calculate Safety Stock in Excel
- Reorder Point vs Safety Stock
- Why is Safety Shot Stock Dropping
- Why is Stock Rotation Important in Relation to Food Safety
- What is Free Stock in Inventory Management
- What is Stock Out Cost in Inventory Management
- How to Manage Stock Effectively
- Stock Inventory Definition
- How to Resolve Stock Discrepancy?
- What is Fluctuation Stock in Inventory Management
- How to Stock Control