


Average Days To Sell Inventory Formula
The average days to sell inventory formula is: (Average Inventory ÷ Cost of Goods Sold) × Number of Days in the Period. For a full year, use 365 days. The result tells you how many days it takes to turn your stock into a sale. Wholesale distributors use this number to spot slow-moving stock, free up cash, and buy smarter. Last reviewed: October 2026.
Book a callWhat the Average Days to Sell Inventory Formula Measures
Days Inventory Outstanding (DIO) is the number of days it takes your warehouse to convert stock into a completed sale. Think of it as a stopwatch that starts when product lands on your shelf and stops when the customer pays.
For wholesale distributors and warehouse operators, this number matters because cash is tied up in stock until the sale closes. A long DIO means more cash sitting in the warehouse and less available for payroll, freight, or new orders. A short DIO means product moves fast and cash cycles back quickly. One sentence for the warehouse supervisor: DIO tells you how long your money is stuck on the shelf.
We build it for your operation, and the first look is free
If you would rather not compare products, describe how your operation already works and we build the system around it.
No build cost. You see it running on your own process first, and the monthly subscription starts only once it is live.
Book a callThe Average Days to Sell Inventory Formula
Write this on the whiteboard:
Days to Sell Inventory = (Average Inventory ÷ Cost of Goods Sold) × Days in the Period
Use 365 for a full year. Use 90 for a quarter. The inputs come straight from your accounting system. GS1, the global standards body behind barcode and supply chain data, notes that accurate item-level tracking is the foundation of any reliable inventory count, see GS1 barcode standards for the scan-based counting methods that feed these figures. Without clean counts, the formula produces a clean-looking wrong answer.
How Do You Calculate Average Inventory for This Formula?
Average Inventory = (Beginning Inventory + Ending Inventory) ÷ 2. Pull both figures from your QuickBooks balance sheet: run a report at the start of the period and again at the end, then average the two inventory totals.
Distributors with seasonal stock should be careful here. A single beginning-and-ending average can swing wildly if one period ends during a peak and the next starts in a slow month. In that case, a rolling average across 12 monthly balances gives a truer picture of what you actually carry. Most QuickBooks plans let you export monthly balance sheets in a few clicks, which makes building that rolling average straightforward.
How to Find Cost of Goods Sold
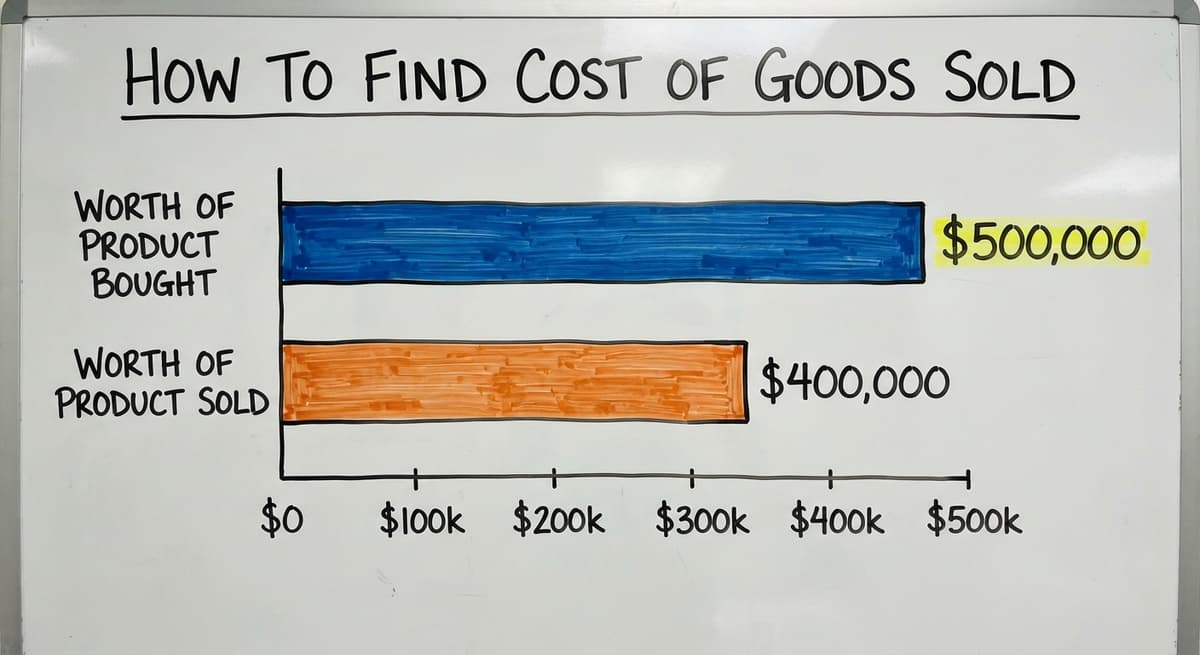
Cost of Goods Sold (COGS) comes from the income statement, not the inventory count. It is not the total value of everything you bought during the period. It is the cost of what you actually sold.
The difference matters. If you bought $500,000 worth of product but only sold $400,000 worth, your COGS is $400,000. The rest sits in inventory. QuickBooks calculates COGS automatically when inventory items are set up as inventory parts rather than non-inventory parts. If your COGS line looks wrong or missing, check item setup first. Using the right COGS figure is what keeps the formula honest.
The IRS agrees this number matters beyond operations. IRS Publication 538 states: "To figure taxable income, you must value your inventory at the beginning and end of each tax year." That legal obligation is also what makes the formula inputs auditable.

A Step-by-Step Example
Here is a concrete run-through using real numbers.
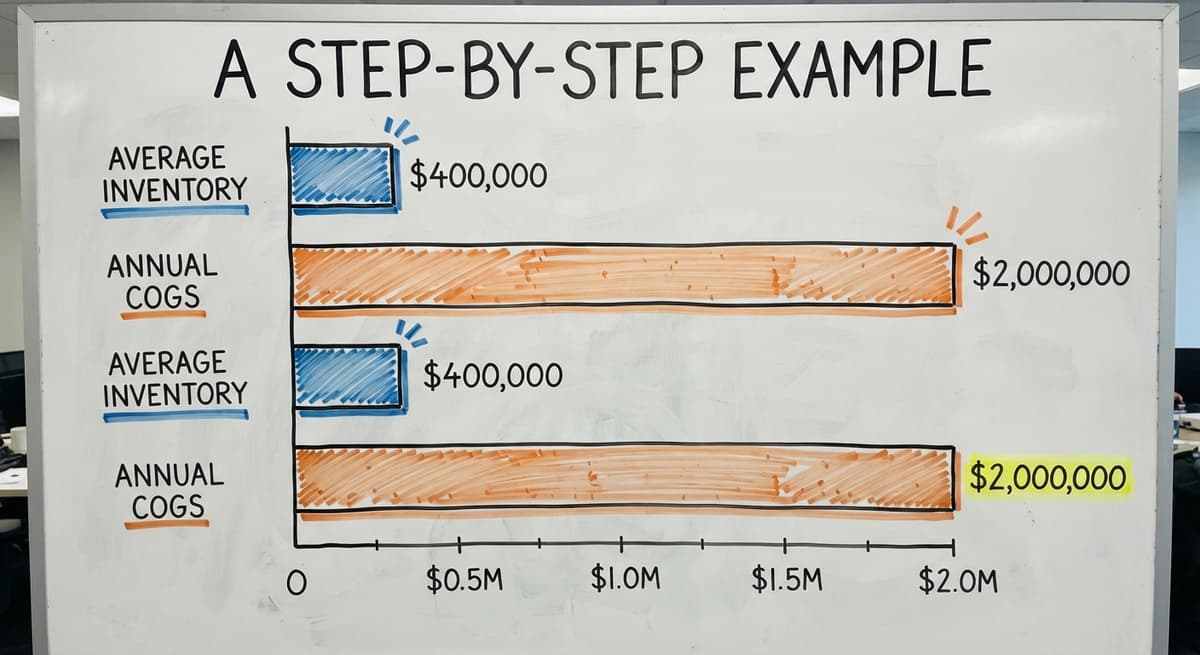
A wholesale distributor carries $400,000 in average inventory and posts $2,000,000 in COGS over the full year.
The math:
- Divide average inventory by COGS: $400,000 ÷ $2,000,000 = 0.20
- Multiply by the number of days: 0.20 × 365 = 73 days
In plain language: it takes about 73 days to sell through the average unit of stock. That means cash is tied up in the warehouse for roughly 10 weeks before it comes back. Whether 73 days is good or bad depends on the product category and the distributor's trend over time. The number itself is less important than watching it move.
The comparison is easier when one option is built for you
Off-the-shelf means fitting your process to the software. We do it the other way round, and the first look costs nothing.
Book a callRunning the Formula for a Shorter Period
To calculate DIO for a single quarter, swap 365 for 90 and use that quarter's COGS only. Do not use the full-year COGS figure with a 90-day multiplier. That mix produces a number that means nothing.
Using the same distributor: if Q2 COGS was $480,000 and average inventory for that quarter was $410,000, then DIO = (410,000 ÷ 480,000) × 90 = 76.9 days.
A quarterly view is useful because it catches seasonal slowdowns before they become a cash problem. If DIO climbs from 73 days in Q1 to 90 days in Q3, that is a signal worth acting on before Q4 buying begins.

What a Good Number Looks Like for Wholesale Distribution
There is no single right answer. Benchmarks vary widely by product category. A distributor selling fast-moving consumables might run 20 to 30 days. A distributor of slow-moving industrial parts might run 90 to 120 days and be perfectly healthy. The US Census Bureau's Monthly Wholesale Trade data tracks national inventory-to-sales ratios by sector, which gives a rough reference point for your category.
The more useful habit is tracking your own trend. A DIO that rises from 60 to 85 days over 3 quarters is a warning sign regardless of what the industry average says. Lower days means leaner, faster-turning stock. Higher days means more cash locked up. Chase the trend, not the benchmark.
High Days to Sell: What It Usually Means
A rising DIO is almost always a buying or forecasting problem. The most common causes:
- Over-ordering based on optimistic demand forecasts that did not hold
- Slow-moving or obsolete SKUs that inflate the average inventory balance without contributing to sales
- Receiving errors that record stock as available when it is damaged or misplaced
- Seasonal stock left over after peak demand passes
Every extra day of DIO is cash that cannot pay a vendor, cover freight, or fund a new product line. The NIST Manufacturing Extension Partnership identifies excess inventory as one of the primary sources of waste in distribution supply chains. The formula gives you the number; the fix is in the buying decision.

Is a Very Low Days-to-Sell Number Always Good?
A low DIO is generally a positive sign: stock moves fast and cash cycles back quickly. But a number that drops sharply or sits unusually low can signal stockouts rather than efficiency.
If product sells out before the next order arrives, you are missing sales and possibly losing customers to a competitor who had stock. The goal is a range that keeps service levels high without carrying excess inventory. The FTC's guidance on order fulfillment makes clear that sellers must ship when they say they will, which means stockouts carry a compliance risk alongside the lost revenue. A healthy DIO sits in the band where you rarely stock out and rarely overstock.
How This Formula Connects to Cash Flow
DIO is a direct window into working capital. Every day of inventory is a day of cash tied up in the warehouse rather than available for operations.
For a distributor with $2,000,000 in annual COGS, each day of DIO represents roughly $5,479 in tied-up cash ($2,000,000 ÷ 365). Cutting DIO by 10 days frees up about $54,790 in working capital. That is real money available for vendor discounts, freight improvements, or payroll.
DIO is one component of the cash conversion cycle, which measures how long it takes a business to convert spending on inventory into cash from a sale. The shorter the cash conversion cycle, the less outside financing a distributor needs to fund growth. Tracking DIO monthly keeps that cycle visible before it becomes a credit problem.
See it running on your own process first
No build cost. The subscription starts once it is live and doing the job, not before.
Book a call
Common Mistakes When Calculating Days to Sell Inventory
Three errors show up repeatedly in distributor calculations.
- Using revenue instead of COGS overstates how quickly inventory moves, because revenue includes your margin. COGS is the cost basis that matches the inventory valuation on your balance sheet.
- Using ending inventory only distorts results at period boundaries, especially if you just received a large shipment or ran a clearance sale. Always average beginning and ending balances.
- Mixing time periods produces meaningless output. Annual COGS paired with a single month's inventory balance is not a valid DIO. Match the inventory period to the COGS period every time.
Any one of these mistakes can make a 90-day DIO look like 55 days, which leads to buying decisions based on a number that was never real.
Why Distributors Running QuickBooks Struggle to Track This Metric
QuickBooks gives you every number the formula needs. It does not run the formula for you.
Most operations managers export the balance sheet and income statement to Excel, build the calculation manually, and repeat the process every month. That workflow takes time and introduces risk at every handoff. When inventory data lives in multiple places, such as QuickBooks, a receiving spreadsheet, and printed pick sheets, the beginning-inventory figure pulled from one source may not match what another source recorded.
The Bureau of Labor Statistics reports that stock clerks and order fillers earn a median wage around $17 to $19 an hour. An operations manager spending 3 hours a month reconciling DIO inputs across systems is spending roughly $60 to $75 in labor on a calculation that should take minutes. Multiply that across 12 months and the manual process costs over $800 a year before accounting for the errors it produces.

How Spreadsheet Workarounds Create Errors Over Time
The Excel rebuild is a version control problem waiting to happen. Each month, someone copies last month's file, updates a few cells, and saves a new version. If the beginning-inventory figure for March was wrong, every month that follows carries that error forward.
A single bad input ripples through every ratio that touches inventory: DIO, inventory turnover, and any cash flow projection built on top of them. The operations manager ends up spending time fixing the spreadsheet rather than acting on what the number says. Replacing Excel workflows with custom software removes the manual rebuild entirely and keeps the inputs tied directly to the source data in QuickBooks.
Tracking Days to Sell Inventory Inside Your Operations Software
Custom operations software can pull COGS and inventory balances directly from QuickBooks and calculate DIO automatically at each period close.
The practical difference: instead of rebuilding a spreadsheet on the 5th of every month, the operations manager opens a dashboard and sees a current number. The inputs do not drift because they come from one source. The formula does not change because no one is editing it.
Inventory management software for wholesale distributors built around this model also lets managers track DIO by product category or SKU, not just at the company level. A company-wide DIO of 73 days can hide a subset of SKUs running at 200 days. Category-level visibility is where the buying decisions actually improve.
Not sure this is the right shape for your operation
Describe how the work runs today. We map it on a call and show you what it would look like built around that, before you spend anything.
Book a call
Can You Keep QuickBooks and Still Get Better Inventory Reporting?
Yes. QuickBooks stays in place for accounting. No migration, no data loss, no retraining on a new general ledger. Custom software wraps around it to handle the working layer: inventory tracking, receiving, fulfillment, and reporting.
How custom operations software works alongside QuickBooks is straightforward in practice. The custom layer reads from QuickBooks via API, runs the calculations, and surfaces the results in a dashboard built for operations rather than accounting. This approach fits businesses running 5 to 100 staff. It is not an enterprise ERP replacement. The goal is to give an operations manager the metrics they need without pulling the accounting team into a platform migration they did not ask for.
Using Days to Sell Inventory to Make Smarter Buying Decisions
When DIO is tracked by SKU or product category, it becomes a buying tool rather than a reporting exercise.
- High-DIO SKUs are candidates for reduced reorder quantities, longer reorder intervals, or promotional clearance to recover cash
- Low-DIO SKUs with strong margins signal where to increase stock before a stockout hurts service levels and customer relationships
- Category-level trends show which product lines are drifting toward excess before the balance sheet reflects the full cost
Working KPIs for wholesale distribution become actionable when they connect directly to a purchasing decision. A buyer who can see that SKU A runs 140-day DIO and SKU B runs 22-day DIO makes a different reorder call than one working from gut feel. The formula gives the evidence; the dashboard makes it visible without a monthly rebuild.
Pairing Days to Sell with Inventory Turnover Ratio
Inventory turnover ratio for warehouse operations is the inverse of DIO. The formulas:
- Inventory Turnover = COGS ÷ Average Inventory
- DIO = Days in Period ÷ Inventory Turnover
Using the earlier example: $2,000,000 ÷ $400,000 = 5.0 turns per year. And 365 ÷ 5.0 = 73 days. Same result, different shape.
Use whichever number is easier to explain to your team. Turns per year is intuitive for buyers. Days is intuitive for operations managers thinking about cash. Tracking both gives a complete picture of how quickly the warehouse converts stock into revenue, and the two numbers cross-check each other when one looks off.
How Often Should You Run This Calculation?
Monthly is the minimum for most distributors. A quarterly cadence misses too many turning points, especially in businesses with seasonal demand or frequent supplier changes.
Operations with high SKU counts benefit from weekly visibility at the category level. Watching a category's DIO climb over 4 consecutive weeks is far more useful than catching it at the quarterly review. Automating the calculation removes the time barrier entirely, so frequency stops being a trade-off between accuracy and effort.
Getting More from Your Inventory Data
The average days to sell inventory formula is one metric inside a broader set of working KPIs. On its own, it tells you how long stock sits. Paired with inventory turnover, cash conversion cycle, and fill rate, it tells you whether the warehouse is running quickly or quietly bleeding cash.
When the formula lives in a spreadsheet, it is a monthly chore. When it is built into the software, it becomes a management tool that updates itself. For wholesale distributors and fulfillment operations ready to move beyond manual tracking, the practical next step is a conversation about custom operations software built around the QuickBooks setup already in place. No migration. No disruption. Just the numbers the operation actually needs, when they are needed.
Frequently asked questions
How to calculate average inventory days?
Divide average inventory by cost of goods sold, then multiply by the number of days in the period. Average inventory is the beginning balance plus the ending balance divided by 2. Use 365 for a full year or 90 for a quarter. Both figures come from your QuickBooks balance sheet and income statement.
What is the formula for calculating days sales in inventory?
Days Sales in Inventory = (Average Inventory ÷ Cost of Goods Sold) × Days in Period. Always use COGS, not revenue. Revenue includes your margin and will make inventory look like it moves faster than it does, which leads to underbuying and stockouts.
What is the 80/20 rule in inventory?
The 80/20 rule holds that roughly 80% of your sales usually come from 20% of your SKUs. The split varies by business, but a small number of items drive most revenue. Tracking DIO by SKU makes this visible. High-volume items deserve tighter reorder discipline; slow-moving items are where excess inventory builds.
What is a good inventory days ratio?
There is no single right number. Fast-moving consumer goods distributors may target 20 to 40 days. Industrial parts distributors may run 90 to 150 days and be healthy. Track your own trend over time rather than chasing an industry average. A rising DIO is a warning sign regardless of where competitors sit.
What is the difference between using COGS and using revenue in the average days to sell inventory formula?
COGS is the cost basis of what you sold. Revenue includes your markup. Inventory on the balance sheet is valued at cost, so COGS is the correct match. Using revenue makes your inventory look like it turns faster than it does, which produces an optimistic number that leads to poor buying decisions.
How does days to sell inventory connect to cash flow?
Every day of DIO is a day of cash sitting in the warehouse. For a distributor with $2,000,000 in annual COGS, each day of DIO ties up about $5,479. Cutting 10 days of DIO frees roughly $54,790 in working capital available for vendor discounts, freight, or reducing reliance on a credit line.
Why is tracking this metric difficult when data lives in QuickBooks and Excel?
QuickBooks holds the raw numbers but does not calculate DIO automatically. Most operations managers export to Excel and rebuild the formula each month. When inventory data also lives in spreadsheets or printed pick sheets, the inputs drift and the result becomes unreliable. Custom software that reads directly from QuickBooks removes the manual step.
How can operations software automate this calculation without replacing QuickBooks?
Custom software connects to QuickBooks via API, pulls balance sheet and income statement figures at each period close, and runs the formula automatically. QuickBooks stays in place for accounting. The custom layer handles working reporting. The operations manager sees a current DIO on a dashboard rather than rebuilding a spreadsheet each month.
Start with a free first look
A 30 minute call, your operation mapped, and a clear picture of what we would build. No obligation and nothing to install.
Book a callRelated guides
The rest of this guide, for the parts of the job this page does not cover.
Guides
- Classification of Inventory
- Excess Inventory
- Closed for Inventory
- Multi Location Inventory Management Software
- Ms Excel Inventory Template
- Inventory Management for Multiple Locations
- Costing Inventory
- Is Inventory a Long-term Asset
- Inventory Management System for Manufacturing
- Inventory Fixed Assets
- Inventory Management Pics
- Inventory Monitoring
- Excel Inventory Template
- Push and Pull Inventory
- Types of Inventory Control
- Consumable Inventory
- B2b Inventory Management
- Jewelry Inventory Management
- Dental Inventory Management
- The Objective of Inventory Management is To
- Qr Code for Inventory Management