

How To Calculate Cycle Stock
Cycle stock is the working inventory you use and replace on a regular schedule. To calculate it, multiply your average daily demand by your replenishment lead time, then divide by 2. A product that sells 20 units a day with a 7-day lead time has a cycle stock of 70 units. That single number tells you how much inventory flows through your operation in a normal cycle.
Reviewed September 2026. Figures are worked from the assumptions stated beside them, so you can substitute your own and the arithmetic still holds.
Reviewed and updated: June 2025
Book a callWhat Is Cycle Stock and How Is It Different from Safety Stock?
Cycle stock is the portion of inventory you regularly use and replenish between orders. It flows in, gets sold or consumed, and gets replaced on a predictable schedule. Safety stock is different. It sits behind the cycle stock as a buffer for unexpected demand spikes or supplier delays.
Think of it this way. Cycle stock is the groceries you buy every week. Safety stock is the extra cans in the pantry for when a storm keeps you home. Knowing which is which matters because the two need different math and different ordering logic. Mixing them up leads to either bloated stock levels or surprise stockouts.
We build it for your operation, and the first look is free
If you would rather not compare products, describe how your operation already works and we build the system around it.
No build cost. You see it running on your own process first, and the monthly subscription starts only once it is live.
Book a callWhy Cycle Stock Matters for Distributors and Warehouses
Carrying too much cycle stock ties up cash and eats warehouse space. Carrying too little means stockouts and missed orders, which costs you customers. For small wholesale distributors running on QuickBooks and spreadsheets, miscalculating cycle stock is one of the most common and costly inventory mistakes.
Accurate cycle stock levels let you order smarter and free up working capital for other parts of the business. There is also a legal reason to get this right. The IRS states directly, in IRS Publication 538, that "to figure taxable income, you must value your inventory at the beginning and end of each tax year." Getting your inventory levels wrong is not just an working problem. It is a compliance problem.
What Is the Formula for Calculating Cycle Stock?
The cycle stock formula is: Cycle Stock = (Average Daily Demand × Lead Time) / 2. Each variable is straightforward. Average daily demand is how many units you sell or consume per day. Lead time is the number of days between placing an order and receiving it. Dividing by 2 reflects the average inventory level across one replenishment cycle, since stock starts high right after a delivery and drops to near zero just before the next one.
The formula works because inventory does not sit at its peak level all cycle long. It declines steadily, so the average on hand at any given moment is roughly half the amount you receive per order.
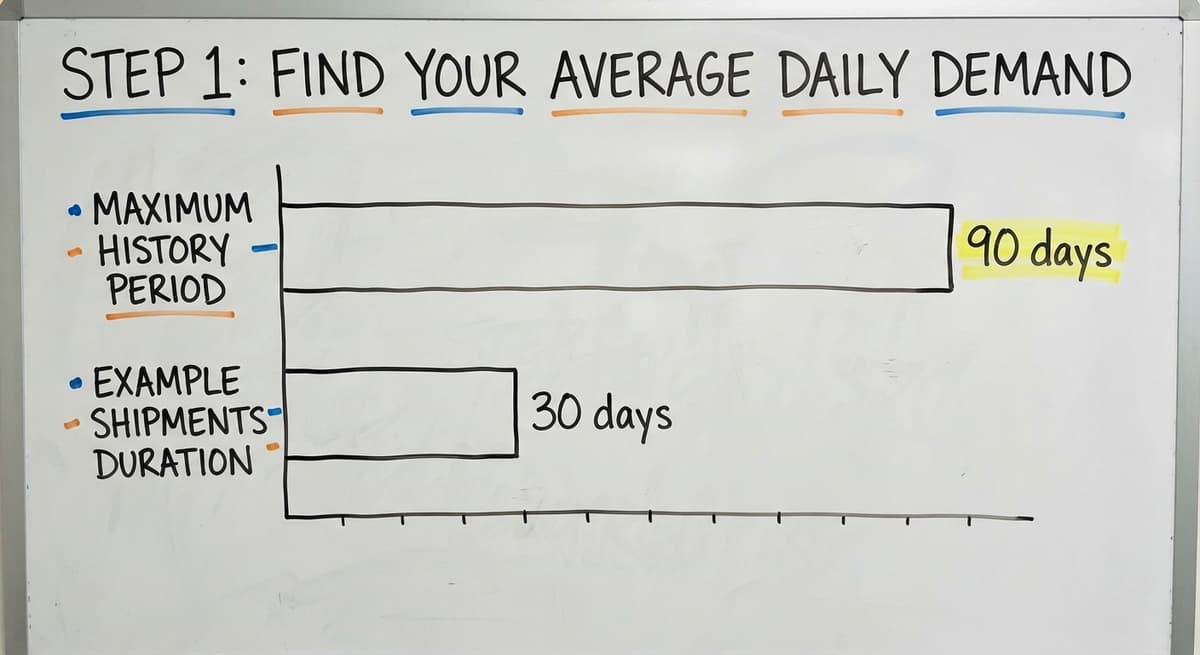
Step 1: Find Your Average Daily Demand
Pull the total units sold or consumed over a recent period. Thirty, 60, or 90 days all work. Then divide by the number of days in that window.
Example: Your warehouse shipped 600 units of a product over 30 days. Divide 600 by 30 and you get an average daily demand of 20 units per day.
A few practical tips here:
- Use the same time window consistently across all SKUs so your numbers stay comparable.
- Pull demand data, not just sales data. Returns and backorders can distort a raw sales figure.
- If you have seasonal swings, use a window that reflects the period you are planning for, not just the most recent stretch.
Consistency matters more than precision at this step. A clean, repeatable method gives you numbers you can actually act on.
Where to Pull Demand Data
QuickBooks holds solid sales history. Run a sales by item report for your chosen window and export it to a spreadsheet. Divide each SKU's total units by the number of days. That gives you a demand figure per SKU in about 10 minutes per product line. For operations tracking dozens of SKUs, a custom inventory tool can automate this step and pull live data directly from QuickBooks.
The comparison is easier when one option is built for you
Off-the-shelf means fitting your process to the software. We do it the other way round, and the first look costs nothing.
Book a call
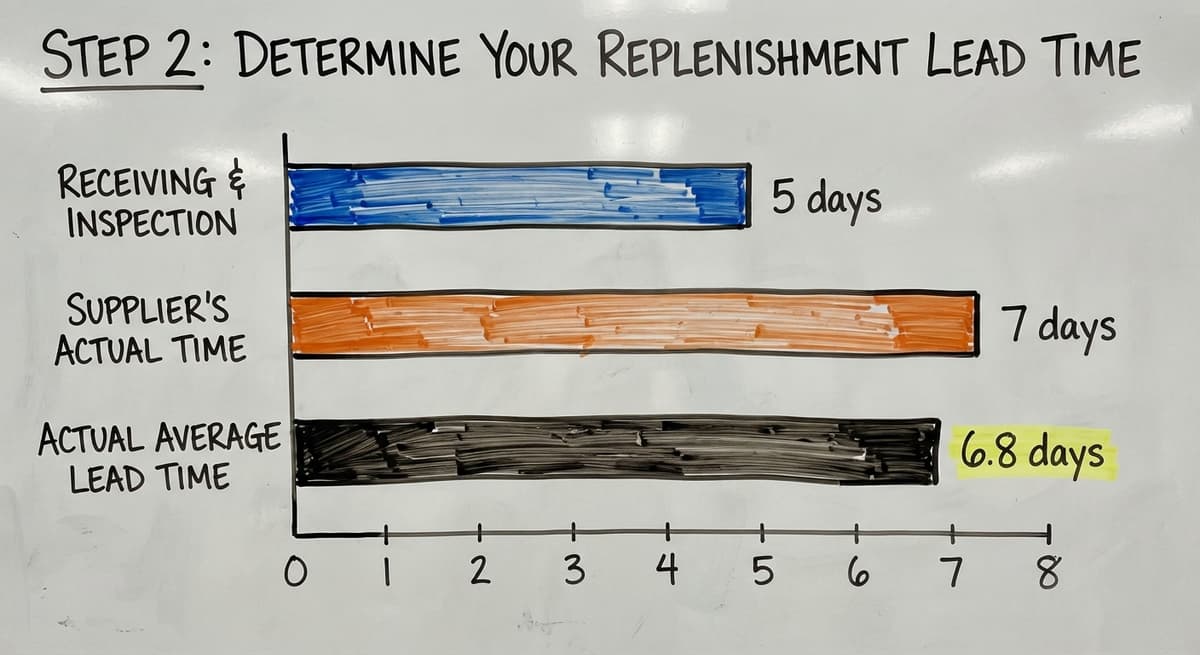
Step 2: Determine Your Replenishment Lead Time
Lead time is the number of days between placing a buy order and having the goods available to sell. Do not use the delivery window your supplier quotes. Use the actual average from your own buy order history.
Account for every delay in the chain:
- Transit days from the supplier's dock to yours
- Receiving and inspection time at your warehouse
- Any internal processing before the item is available in your system
Example: your supplier says 5 days, but your last 6 orders took 6, 7, 7, 8, 6, and 7 days. Your real average lead time is 6.8 days. Round up to 7. Using the promised number instead of the real one is a common source of stockout errors.
Step 3: Apply the Cycle Stock Formula
Now put the two numbers together. From Step 1, average daily demand is 20 units. From Step 2, lead time is 7 days.
Cycle stock = (20 × 7) / 2 = 70 units.
In practice, that means you should have about 70 units on hand at the midpoint of any replenishment cycle. Right after a delivery, you will have closer to 140 units. Just before the next order arrives, you will be near zero. The 70-unit figure is the average you plan around.
Two things to keep in mind:
- This is average cycle stock, not your reorder point. You need to add safety stock to get the reorder point.
- This calculation applies to one SKU at a time. Run it separately for each item. A single blended number across all products is not actionable.
For a small distributor with 50 SKUs, running this calculation takes about an hour in a spreadsheet the first time. After that, updating it takes minutes per SKU.

Cycle Stock vs. Reorder Point: Do Not Confuse Them
The reorder point is cycle stock plus safety stock, and these two numbers answer different questions. Cycle stock tells you how much inventory flows through in a normal cycle. The reorder point tells you when to place the next order.
Using the example above: cycle stock is 70 units. If you also hold 30 units of safety stock as a buffer against demand spikes, your reorder point is 100 units. When stock on hand drops to 100, you place the order. When it arrives, you are back above the safety stock floor.
Mixing up these two numbers leads to either placing orders too early, which inflates carrying costs, or placing them too late, which causes stockouts. A safety stock calculation guide can help you size that buffer correctly once you have your cycle stock dialed in.
Adjusting Cycle Stock for Seasonal or Uneven Demand
A flat average daily demand number can mislead you when demand swings by season or by customer. If you sell 3 times as many units in Q4 as in Q2, a full-year average understates your peak need and overstates your slow-season need.
Use a rolling average that reflects the period you are planning for, not just the past.
For distributors with a handful of large accounts, one big order can skew the average badly. A single customer placing a 500-unit order in a 30-day window inflates your daily demand figure for that period. Consider these adjustments:
- Calculate cycle stock by SKU rather than across product categories.
- Separate your top 3 to 5 accounts and calculate demand with and without them.
- Use a 90-day rolling average during stable periods and a shorter 30-day window heading into a known peak season.
- Recalculate cycle stock at least every quarter, or any time you see demand shift by more than 20%.
The US Census Bureau tracks national inventories-to-sales ratios for wholesale firms at Monthly Wholesale Trade, which can give you a useful benchmark for whether your stock levels are running high or lean relative to your sector.
Seasonal demand does not break the formula. It just means you feed it fresher inputs more often.
See it running on your own process first
No build cost. The subscription starts once it is live and doing the job, not before.
Book a call
Does Order Frequency Change My Cycle Stock Levels?
Yes. Ordering more often directly reduces average cycle stock and lowers carrying costs. If you order every 7 days instead of every 14, you receive smaller batches more frequently. Your average on-hand inventory drops, which frees up cash and space.
Ordering less often has the opposite effect. It increases cycle stock but may reduce the cost per order or help you hit a supplier's minimum order quantity. Small distributors often order less frequently to meet those minimums, which inflates cycle stock beyond what demand actually needs.
The economic order quantity (EOQ) model helps find the right balance. EOQ weighs ordering costs against carrying costs to find the order size that minimizes total inventory expense. The NIST Manufacturing Extension Partnership offers vendor-neutral guidance on supply chain decisions like this at nist.gov/mep/supply-chain.
A practical starting point: if you are ordering once a month only because the supplier needs a minimum, ask whether a smaller, more frequent order is available. Even a modest shift from monthly to bi-weekly ordering can cut average cycle stock by close to 50% for fast-moving SKUs.
Common Mistakes When Calculating Cycle Stock
Small distributors tend to make the same errors. Knowing them in advance saves a lot of rework.
- Using raw sales data instead of demand data pulls in returns and unfulfilled backorders, which distort the true consumption rate.
- Forgetting to update lead times when a supplier changes carriers or moves warehouses leaves you working from stale inputs.
- Applying one formula result across all SKUs ignores the fact that fast-movers and slow-movers behave very differently and need separate calculations.
- Confusing cycle stock with total inventory on hand leads to treating safety stock as available for normal orders, which erodes your buffer without warning.
Each of these errors is easy to fix once you spot it. The harder problem is that they compound quietly over months until a stockout or a cash crunch makes the gap visible.

Tracking Cycle Stock Without a Big ERP
Many small distributors manage cycle stock in Excel, and that works fine up to a point. The limit hits when SKU counts grow past a few dozen, data gets stale between manual pulls, or one person leaving takes the spreadsheet logic with them.
QuickBooks holds the sales history you need, but it does not calculate cycle stock automatically. You have to export the data, build the formula in a spreadsheet, and remember to update it. That manual step is where errors creep in.
Inventory management software for small distributors can close that gap. A custom inventory tool built to connect with QuickBooks can pull live demand data by SKU, apply the cycle stock formula automatically, and flag items where stock levels are drifting out of range. The goal is to remove the manual export-and-calculate loop entirely.
The Bureau of Labor Statistics shows that stock clerks and order fillers earn a median wage around $18 to $19 an hour. If 2 people spend 4 hours a week pulling and reconciling inventory reports, that is roughly $7,500 a year in labor just to keep a spreadsheet that is already out of date by the time it is finished. Custom workflow rollout can replace that loop with a system that runs on its own.
Custom inventory tracking for wholesale operations does not need a full ERP. It needs a tool sized for your actual SKU count and connected to the data you already have.
When to Recalculate Cycle Stock
Recalculate whenever a key input changes, and review all SKUs on a fixed schedule regardless. The inputs that matter most are lead time and demand rate. Both shift more often than most operators expect.
Specific triggers to act on:
- A supplier changes their lead time, even by 1 or 2 days
- You add or lose a major customer whose volume moves your daily demand figure
- A new season or promotional period begins
- You change order frequency or hit a new supplier minimum
Set a calendar reminder to review every SKU at least every 90 days. For fast-moving items or volatile accounts, monthly reviews are worth the time. A cycle stock number that is 6 months old is not a plan. It is a guess.

Put the Formula to Work
Calculating cycle stock is not complicated. The formula has 3 inputs, the math takes seconds, and the output gives you a clear target for how much inventory each SKU needs to carry through a normal replenishment cycle.
The harder part is keeping the inputs current, running the calculation by SKU rather than in bulk, and connecting the result to your actual ordering decisions. That is where most small distributors lose the benefit of knowing the formula at all.
If you are still running this math by hand every quarter, consider what a connected system could do instead. How to set reorder points in QuickBooks is a natural next step once your cycle stock numbers are solid. And if the manual process is the bigger problem, The Software Society builds custom workflow systems that connect your existing tools and remove the manual steps that slow you down. Reach out to see what a right-sized solution looks like for your operation.
Frequently asked questions
What is cycle stock and how is it different from safety stock?
Cycle stock is the inventory you use and replace on a regular schedule between orders. Safety stock is a separate buffer that covers unexpected demand spikes or supplier delays. Cycle stock flows in and out predictably. Safety stock sits behind it and should rarely be touched under normal conditions.
What is the formula for calculating cycle stock?
Cycle Stock = (Average Daily Demand × Lead Time) / 2. For example, a product with 20 units of daily demand and a 7-day lead time has a cycle stock of 70 units. The division by 2 reflects the fact that inventory declines steadily across the cycle, so the average on-hand level is half the peak.
How do I find average daily demand for my products?
Pull total units sold or consumed over a 30, 60, or 90-day window and divide by the number of days. Use demand data rather than raw sales figures, since returns and backorders can inflate the number. In QuickBooks, a sales by item report gives you the units you need to start the calculation.
What is the difference between cycle stock and reorder point?
Cycle stock is the average inventory that flows through in a normal replenishment cycle. The reorder point is the stock level that triggers a new order, and it equals cycle stock plus safety stock. Using cycle stock alone as your reorder point ignores the safety buffer and increases your risk of stockouts.
How does order frequency affect cycle stock levels?
Ordering more often reduces average cycle stock because you receive smaller batches more frequently. Ordering less often increases cycle stock. A distributor who shifts from monthly to bi-weekly ordering on a fast-moving SKU can cut average cycle stock by close to 50%, freeing up cash and warehouse space.
How often should I recalculate cycle stock?
Review all SKUs at least every 90 days. Recalculate at once when a supplier changes lead times, when you add or lose a major customer, or when a new season begins. A cycle stock figure that is more than 6 months old is likely based on demand patterns that no longer reflect your business.
Can I calculate cycle stock without an ERP system?
Yes. A spreadsheet connected to QuickBooks sales history is enough for most small distributors with fewer than 100 SKUs. The challenge is keeping inputs current and running the calculation by SKU rather than in bulk. A custom inventory tool can automate the data pull and calculation, removing the manual step that causes most errors.
What mistakes do distributors make when calculating cycle stock?
The most common errors are using raw sales data instead of true demand data, failing to update lead times when suppliers change, applying one formula result across all SKUs instead of calculating by item, and confusing cycle stock with total inventory on hand. Each error is fixable, but they tend to compound quietly until a stockout or cash problem surfaces.
Start with a free first look
A 30 minute call, your operation mapped, and a clear picture of what we would build. No obligation and nothing to install.
Book a callRelated guides
The rest of this guide, for the parts of the job this page does not cover.
Guides
- Calculate Beginning Inventory
- Cloud Stock Management Software
- Hospital Stock Management System
- Make to Stock Examples
- Types of Stock Control Systems
- Warehouse Stock Management Software
- Warehouse Stock Software
- Warehouse Stock Management System
- Small Business Stock Management Software
Common questions
- How to Record Inventory on Hand
- How to Choose a Warehouse Management System
- How to Create a Warehouse Management System
- How to Build a Warehouse Management System
- How to Manage Inventory in a Warehouse
- How to Create a Barcode System for Inventory
- How to Keep Track of Inventory in Warehouse
- How to Design a Warehouse Management System
- How to Set up a Warehouse Management System
- How to Use a Barcode Scanner
- How Warehouse Management System Works
- How to Organize Inventory for Small Business
- How to Keep Track of Inventory Small Business
- How to Manage Inventory for Small Business
- How to Read a Barcode Number