

Excel Stock Management Template
An Excel stock management template is a spreadsheet that tracks what you hold. It also shows where items sit and when to reorder. It needs 3 tabs: an item list, a movement log, and a dashboard. Reviewed November 2026.
Book a callWhat Should an Excel Stock Management Template Include?
3 tabs make a good template: Items, Transactions, and Dashboard. The item list says what you sell. The log records every move. The dashboard shows what needs action. Give each event its own line. Never type over a running total.
The Item Master Sheet
The item master is the sheet that lists each product once. Your Excel stock template needs two groups of columns here.
- Core fields: SKU (a unique product code), description, category, unit of measure, supplier, and bin location.
- Money fields: unit cost, sell price, reorder point, and reorder quantity for each product.
Give each product one SKU and never reuse it. Keep names the same everywhere so lookups do not break. One clean item list is the base every formula stands on.
The Transactions Log Sheet
The log is a tab that records every stock move on its own line. Use these columns: date, SKU, type, quantity, reference number, and initials.
- Type: pick receipt, shipment, adjustment, or return from a short list.
- Sign: enter receipts as positive and shipments as negative, or let the type column decide.
- Reference number: tie each line to a buy order or a sales order in your books.
Never overwrite an old row. Add a correcting row instead. A log that keeps its history can always explain a number.
The Dashboard Sheet
The dashboard is a single tab. An owner can read its few numbers in a minute.
Show the count of items under the reorder point, the unit total, and stock value. Add a chart only if someone will use it. Three numbers read daily beat 20 charts nobody opens.
We build it for your operation, and the first look is free
If you would rather not compare products, describe how your operation already works and we build the system around it.
No build cost. You see it running on your own process first, and the monthly subscription starts only once it is live.
Book a callWho an Inventory Tracking Spreadsheet Works Well For
A spreadsheet suits low SKU counts, 1 location, and 1 or 2 people who keep it. Orders must be few enough to check by hand. It makes a good first stock system. It also works as a stopgap beside your accounting software.
Fit depends on volume and on the number of users. The count itself is not optional. IRS Publication 538 says "you must value your inventory at the beginning and end of each tax year." A small, steady operation is where a sheet earns its keep.
How Do You Calculate Stock on Hand in Excel?
The stock on hand formula is opening count + receipts - shipments +/- adjustments. SUMIFS is an Excel function that adds only the rows that match your rules. It pulls totals per SKU from the log.
Take SKU A100. It opens at 50 units. The log shows 120 received, 90 shipped, and 2 lost. The math is 50 + 120 - 90 - 2 = 78 units.
Format the log as an Excel Table (press Ctrl+T). Formulas then grow with each new row. Let SUMIFS read the log, and no one ever types a stock number.
How Do You Set Up Low Stock Alerts in Excel?
A low stock alert is a flag that shows when on-hand stock falls to the reorder point. Use a formula such as =IF(F2<=G2,"Reorder","OK"). Column F holds on hand. Column G holds the trigger level.
Then add conditional formatting, a rule that colors a cell by its value. Turn the row red when it reads Reorder.
Set that level with this math: daily use x supplier lead time + safety buffer.
At 10 units a day, a 7 day wait, and 20 spare units, the level is 90. Alerts show only when someone opens the file.
How Do You Value Inventory in Excel?
Stock value is quantity on hand times unit cost. If 78 units cost $4 each, the value is $312.
Average cost is the easiest method for a basic sheet. Add up total cost, then divide by total units.
FIFO is a method that sells the oldest units first. Tracking it by hand gets messy fast. Ask your accountant which method your books use. Match that method, and your stock sheet will agree with your reports.
Keeping Stock Management in Excel Accurate
3 habits keep stock management in Excel accurate. They cover entry rules, counts, and routine.
Use Dropdowns to Stop Typos
Most spreadsheet errors come from typing. Data Validation is an Excel tool that limits what a cell accepts.
Add dropdown lists for SKU, transaction type, and location. Block negative numbers and text in quantity cells. Less free typing means fewer bad rows.
Run a Cycle Count
A cycle count is a small count of a few bins or categories on a set day. Add a Counted column and a Variance column. Variance is counted minus expected.
Count one shelf group each week rather than all stock at once. Log each fix as a new row with a reason. Watch which items drift often. Repeat drift points to a cause you can fix.
Not sure this is the right shape for your operation
Describe how the work runs today. We map it on a call and show you what it would look like built around that, before you spend anything.
Book a callSet Daily Habits
A short routine keeps your stock file true. Write it down and post it near the shelves.
- Update on the spot: log each move when it happens, not at the end of the day.
- Name one owner: one person guards the file and teaches the entry steps.
- Protect the file: save dated backups and lock every cell that holds a formula.
- Name files by rule: a fixed naming pattern means no one works in an old copy.
Can Several People Use One Excel Stock File?
2 or 3 people can share one Excel stock file. Cloud-shared workbooks allow editing at the same time.
Conflicts rise as users grow. Limit edit rights and give everyone one entry tab. Past 3 regular users, errors climb.
That is a practical limit, not a failure. The sheet did its job at the size it fits.
Watch for these common mistakes:
- Overtyped totals: someone types over the on-hand number instead of logging the move.
- Messy codes: duplicate SKUs and mixed units, such as each versus case, split one product in two.
- Loose copies: several people edit different copies, and no one knows which is right.
- Broken formulas: inserted or deleted rows break ranges, and nothing records who changed what.
Fewer hands and fixed rules keep one file trustworthy.
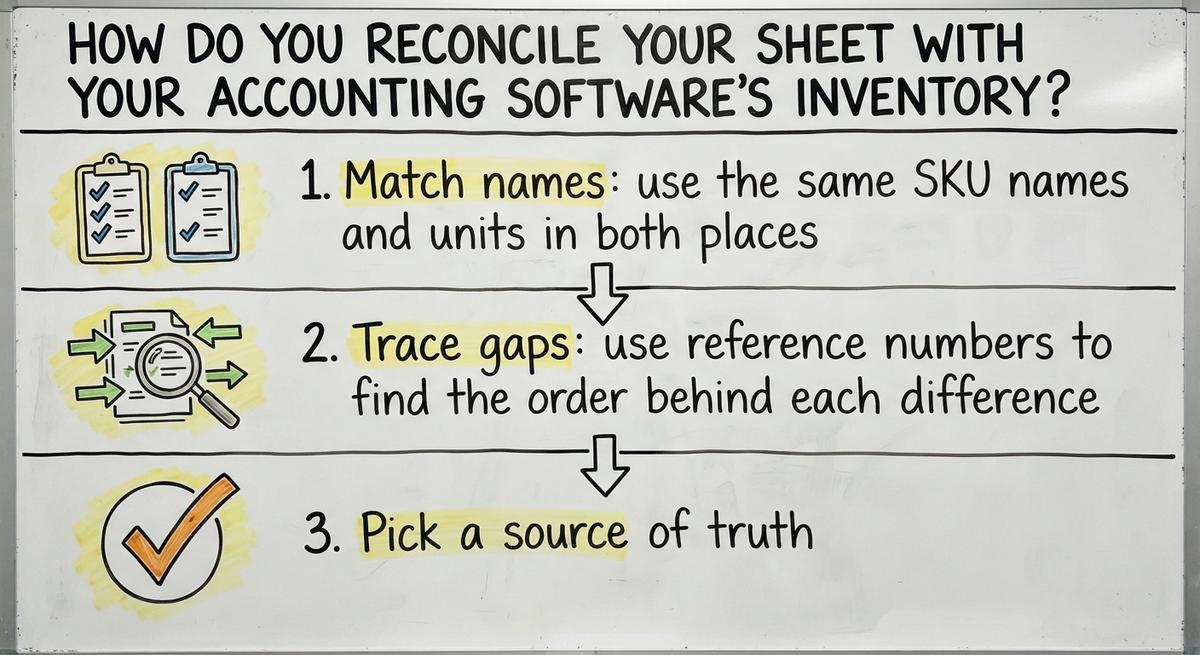
How Do You Reconcile Your Sheet With Your Accounting Software's Inventory?
Reconciling is comparing two sets of numbers and explaining each gap. Do it on a set schedule, such as the first Monday of each month. Compare stock quantities and values.
- Match names: use the same SKU names and units in both places.
- Trace gaps: use reference numbers to find the order behind each difference.
- Pick a source of truth: decide which system owns each number, such as counts in the sheet and costs in your books.
A fixed schedule and a named owner for each number turn a gap into a quick fix.
The comparison is easier when one option is built for you
Off-the-shelf means fitting your process to the software. We do it the other way round, and the first look costs nothing.
Book a callWhen Is Excel No Longer Enough for Stock Management?
5 hours a week at $20 an hour adds up to $5,200 a year spent copying numbers. Excel falls short when upkeep costs more than it saves.
What Excel Cannot Do
Excel has no built-in audit trail or user permissions. It has no barcode scanning flow and no live feed from orders.
It struggles with many locations, lots, and serial numbers. Staff must re-key data between sheets, email, and the accounting software. These gaps are limits of the tool, not of your skill.
Signs You Have Outgrown Your Spreadsheet
Five signs show the sheet has hit its limit.
- Count drift: counts often differ from what sits on the shelf.
- Copy work: staff spend hours each week copying numbers between files.
- One expert: only one person understands how the workbook works.
- Late data: stockouts or overstock happen because the numbers arrive late.
- Many versions: several copies of the file exist and none can be trusted.
Two or more signs mean it is time to act.
Options When Excel Is No Longer Enough
3 paths exist. Tighten the sheet. Add a light tool, such as small business stock management software or cloud stock management software. Or build custom software around your current workflow.
Ask any provider these questions:
- Accounting software: does the tool keep your current accounting setup, or does it replace it?
- Timing: how many weeks pass before you go live?
- Change cost: what does it cost to change the setup later?
Skip a full ERP move if the problem is a few manual steps. Write down your steps first. Any option is easy to judge once you know the steps it must cover.
Checklist Before You Start Your Template
4 items come first. Gather them before you open a blank stock template.
- Clean SKU list: every product has a clear name and one counting unit.
- Opening counts: a full physical count gives each SKU its starting number.
- Reorder points: set them first for your top-selling items.
- One owner: pick one file location, one owner, and one backup plan.
Finish this list today, and build the Items tab tomorrow.
Frequently asked questions
What should an Excel stock management template include?
Three tabs: an item list with SKU, cost, and reorder point, a transaction log with one row per move, and a dashboard that shows low items, total units, and stock value.
How do you calculate stock on hand in Excel?
Start with the opening count. Add receipts, subtract shipments, and adjust for fixes. SUMIFS pulls each total per SKU from the log, so 50 + 120 - 90 - 2 gives 78.
How do you set up low stock alerts in Excel?
Compare on hand to the reorder point with an IF formula that returns Reorder or OK. Then add a color rule so flagged rows turn red when you open the file.
How do you keep an Excel stock sheet accurate?
Log each move as it happens. Limit entries with dropdowns, lock formula cells, save dated backups, and count a few bins weekly. One named owner should guard the file.
Can several people use one Excel stock file?
A small team can, with limits. Give most people one entry tab and few edit rights. Errors climb once more than 3 people update the file on a regular basis.
How do you reconcile a spreadsheet stock sheet with your accounting software?
Share SKU names and units across both. Each month, compare counts and values. Follow reference numbers to explain gaps, and name which system owns each figure.
When is Excel no longer enough for stock management?
Excel falls short when counts miss the shelf, staff lose hours re-keying data, one person holds all the know-how, or many file copies exist. Two such signs mean act now.
Start with a free first look
A 30 minute call, your operation mapped, and a clear picture of what we would build. No obligation and nothing to install.
Book a callRelated guides
More on the same work.
Guides
- Excel Inventory Spreadsheet Templates
- Excel Template for Inventory Control
- Excel Sheet Template for Inventory
- Excel Format for Inventory Management
- Ms Excel Inventory Template
- Excel Inventory Template
- Inventory Control with Excel
- Inventory Tracker Excel
- Excel Spreadsheet for Inventory
- Warehouse Stock Management Software
- Cloud Stock Management Software
- Warehouse Stock Management System
- Small Business Stock Management Software
- Hospital Stock Management System
- Retail Stock Management Software
- Medical Stock Management System
- Excel Barcode
- Inventory Format in Excel