


Classification Of Inventory
Reviewed and updated: July 2025
Reviewed September 2026. Figures are worked from the assumptions stated beside them, so you can substitute your own and the arithmetic still holds.
The classification of inventory means grouping your stock by shared traits, such as value, how fast it moves, or where it sits in your supply chain. Knowing which group each item belongs to tells you how to store it, when to reorder it, and how often to count it. That clarity cuts stockouts, frees up cash, and keeps orders shipping on time.
Book a callWhat Is the Classification of Inventory and Why Does It Matter?
Most warehouse and distribution teams already classify inventory without calling it that. You know which items sell fast. You know which shelf holds the slow stuff. Formal classification just makes that knowledge visible to the whole team, not just the person who has been there longest.
The IRS makes counting and valuing stock a legal requirement, not a preference. IRS Publication 538 states: "To figure taxable income, you must value your inventory at the beginning and end of each tax year." That alone is reason enough to know what you have and what class it falls into.
Classification also connects directly to real pain points: cash tied up in slow-moving inventory, stockouts on your best sellers, and wasted space on items that barely move. GS1, the global standards body behind product barcodes, notes that consistent item spotting is the foundation of any reliable count. You can read their barcode standards at gs1.org. Without a classification system, even a good barcode setup gives you data you cannot act on.
We build it for your operation, and the first look is free
If you would rather not compare products, describe how your operation already works and we build the system around it.
No build cost. You see it running on your own process first, and the monthly subscription starts only once it is live.
Book a callClassification by Stage in the Supply Chain: What Are Raw Materials, WIP, and Finished Goods?
The most basic way to classify inventory is by where each item sits in your supply chain: raw materials, work-in-progress, or finished goods. Fulfillment centers mostly deal with finished goods. Light manufacturers carry all 3 types at once.
Raw Materials and Work-in-Progress Inventory
Raw materials are inputs you have not yet processed or assembled. A distributor who kits products before shipping might hold bulk packaging film as a raw material. The ordering rule here is simple: buy to a schedule, not a whim, because raw materials often have longer lead times and minimum order quantities.
Work-in-progress (WIP) inventory is anything partially assembled or processed. WIP is the hardest class to count correctly because its value changes as labor is added. Small operations often track WIP on whiteboards or shared spreadsheets. That creates gaps: one shift records progress, the next does not, and your count drifts from reality. The gap between what the board says and what is on the floor is where shrinkage hides.
Finished Goods
Finished goods are items ready to ship to a customer right now. Most wholesale distributors and fulfillment centers focus almost entirely on this class. Order accuracy and on-time shipping are the metrics that live here. The US Federal Trade Commission needs sellers to ship by the date promised or notify the customer and offer a refund. See the FTC's Mail and Internet Order Rule for the specifics. An accurate finished-goods count is what keeps you on the right side of that rule.

Classification by Demand and Movement Speed
Once you know where an item sits in the supply chain, the next question is how fast it moves. Movement speed drives 3 key decisions: where you put the item in your warehouse, how often you reorder it, and how much attention you give it during a cycle count.
The 3 speed classes are:
- Fast-moving inventory turns over frequently and needs a prime pick location close to the shipping dock.
- Slow-moving inventory ties up shelf space and cash without contributing much to daily throughput.
- Dead stock has not moved in a defined period, often 6 to 12 months, and is a direct drain on carrying costs.
Most QuickBooks users can pull a sales history report. Few use it to formally sort their SKUs by velocity. That gap is where ABC analysis comes in.
The comparison is easier when one option is built for you
Off-the-shelf means fitting your process to the software. We do it the other way round, and the first look costs nothing.
Book a call
ABC Analysis: The Most Common Inventory Classification Method
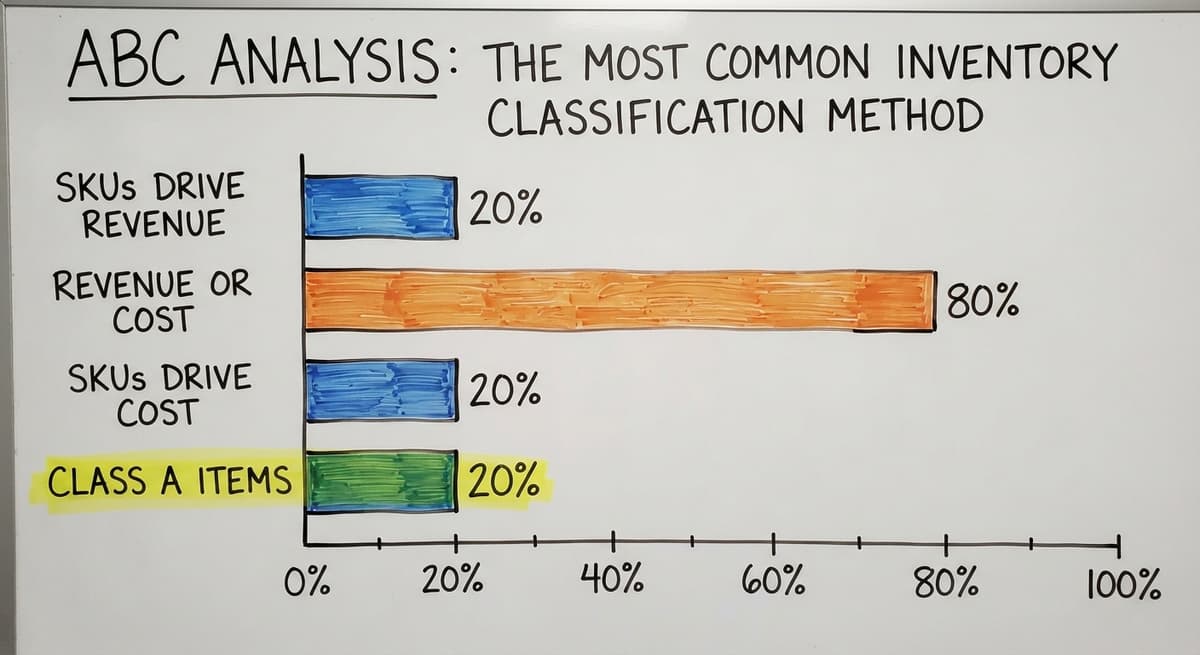
ABC analysis inventory classification splits your SKUs into 3 tiers based on value or velocity. The idea behind it is the 80/20 rule: roughly 20% of your SKUs drive about 80% of your revenue or cost.
- Class A items are that top 20%. They get tight reorder points and frequent cycle counts.
- Class B items are the middle tier. They get periodic review, roughly once a quarter.
- Class C items are the long tail: low value, slow movement, minimal attention.
ABC analysis is easy to understand but hard to keep by hand. Demand shifts. A seasonal item moves from C to A in October and back again in January. Without a system that updates classifications automatically, your tiers go stale and the decisions based on them go wrong.
What Are Class A Inventory Items?
Class A items are the roughly 20% of SKUs that drive about 80% of your revenue or cost. A practical example: in a 500-SKU warehouse, your top 100 SKUs probably account for most of your daily picks. Those 100 items need a reorder point set tight, a bin location that is easy to reach, and a cycle count at least once a month. A stockout on a Class A item costs far more than a stockout on a Class C item.
Class B and Class C Inventory
Class B items sit in the middle: moderate value, moderate movement. Review them quarterly. Watch them closely because demand shifts can push a B item into A territory fast, and missing that shift means a stockout on a product that was trending up.
Class C items are the long tail of SKUs with low value or slow movement. The risk with C items is over-investing: buying too much, storing it too long, and paying carrying costs on stock that barely contributes to revenue. Review C items at least twice a year to identify dead stock before it becomes a write-off. The NIST Manufacturing Extension Partnership recommends regular review cycles as part of sound supply chain practice.

Classification by Inventory Function
Functional classification answers a different question: not what the item is, but why you are holding it. This matters because the reason you hold stock work out how much of it you should carry.
The main functional classes are:
- Cycle stock: the inventory you use up between replenishment orders.
- Safety stock: a buffer held to cover demand spikes or supplier delays.
- Seasonal stock: inventory built ahead of a known demand peak.
- Anticipation inventory: stock bought early because of an expected price increase or supply disruption.
- MRO supplies: items used to keep operations running, not sold to customers.
- Transit inventory: goods moving between your supplier and your warehouse, or your warehouse and your customer.
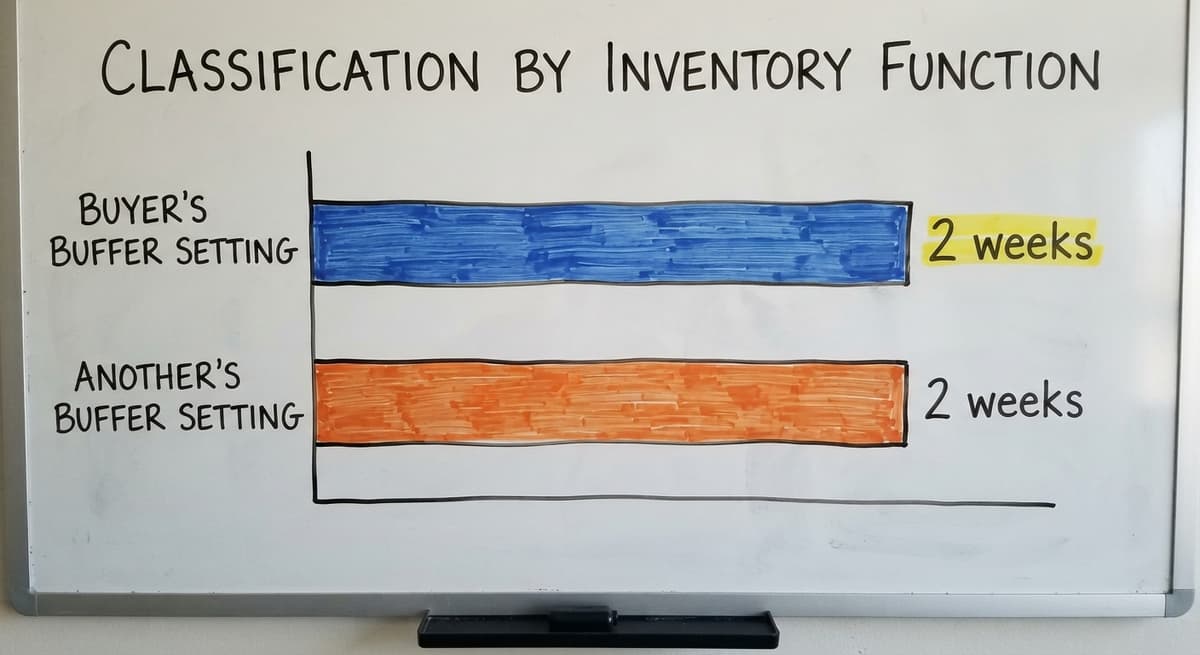
Distributors often carry safety stock without labeling it as such. That makes reorder logic inconsistent: one buyer sets a buffer of 2 weeks, another sets 4, and no one knows why.
Safety Stock and Cycle Stock
Cycle stock is the inventory you burn through between orders. If you order every 2 weeks and sell 50 units a day, your cycle stock is about 700 units. Safety stock is the extra buffer you hold on top of that to cover a late shipment or a sudden demand spike.
Confusing the two leads to one of 2 problems. Hold too little safety stock and you hit a stockout the moment a supplier runs late. Hold too much and you pay carrying costs on stock that rarely gets touched. Defining both numbers separately, for each SKU, is what keeps reorder points accurate.
Seasonal, Anticipation, and MRO Inventory: What Often Gets Overlooked?
Seasonal stock is built up ahead of a predictable demand peak, like buying extra units of a product that spikes every November. Anticipation inventory is bought early because of an expected price increase or a supply disruption, not because demand is high right now. Both types need forward-looking planning that a spreadsheet handles poorly, because the inputs change and the file does not update itself.
MRO inventory covers supplies that keep your operation running: pallet wrap, printer labels, forklift batteries. These items are never sold to a customer, but running out of them stops your warehouse cold. Transit inventory, goods moving between locations, affects your cash flow and your available capacity even though it is not on a shelf yet. Both are easy to ignore in informal systems, and both show up as surprises when you need them most.
See it running on your own process first
No build cost. The subscription starts once it is live and doing the job, not before.
Book a call
How Inventory Classification Breaks Down Without the Right System
Here is the scenario that plays out in most small operations. Classification exists in one person's head, or in a color-coded spreadsheet that only that person fully understands. It works fine until that person takes a vacation, or leaves.
When volume grows or staff turns over, the problems stack up fast:
- Reorder points get set from memory rather than data, so some items run out and others pile up.
- Cycle counts focus on whatever feels urgent rather than on Class A items by schedule.
- Safety stock targets drift because no one wrote them down in a place the whole team can see.
- Dead stock sits on shelves for months because no one runs a formal C-item review.
The US Census Bureau's Monthly Wholesale Trade data tracks the inventories-to-sales ratio for wholesale firms nationally. When that ratio climbs, it usually means stock is accumulating faster than it is moving, which is exactly what happens when classification breaks down.
This is a systems gap, not a people failure. The fix is making classification rules visible, consistent, and independent of any one person's memory.
Consider the labor cost alone. 3 people spending 6 hours a week reconciling spreadsheet counts at $22 an hour adds up to $20,592 a year. The Bureau of Labor Statistics puts the median wage for stock clerks and order fillers in that range. That figure does not include the cost of the mistakes those hours still produce.

Putting Inventory Classification Into Practice
Classification is not a one-time project. It is an ongoing process that the whole team runs together. Here is how to start:
- Pull your full SKU list from QuickBooks or your current system.
- Assign a supply chain stage to each item: raw material, WIP, or finished good.
- Run a basic ABC analysis using 12 months of sales data. Sort by revenue contribution. The top 20% of SKUs are your A items.
- Set a reorder point for each A item based on lead time and average daily demand.
- Label your safety stock targets separately from cycle stock for every A and B item.
- Flag MRO items in a separate category so they do not skew your sales-velocity data.
- Schedule review cycles: A items monthly, B items quarterly, C items twice a year.
- Write the rules down in a shared document so any team member can apply them.
The goal is consistent, team-wide visibility, not a perfect spreadsheet that one person keeps.
How Software Supports Inventory Classification
Good inventory management software for small distributors applies classification rules automatically. It watches movement data and updates ABC tiers as demand shifts, so your Class A list reflects last month's sales, not last year's.
QuickBooks tracks quantities and costs well. It does not apply ABC analysis, flag dead stock, or trigger reorder points based on safety stock logic. That is not a flaw in QuickBooks. It is an accounting tool, and it does that job well. A purpose-built inventory layer sits on top of it, handles classification and cycle count scheduling, and passes the financial data back to QuickBooks without forcing a full system migration.
Custom workflow software can also match the classification logic your business already uses rather than forcing you into a generic framework. If your team classifies by product line and velocity together, the system can reflect that. The right software makes classification something the whole operation runs on, not something one person keeps in a file on their desktop.
Frequently Asked Questions About Inventory Classification
What is the simplest inventory classification method to start with? ABC analysis using your existing sales data is the easiest entry point. Sort your SKUs by revenue over the last 12 months. The top 20% are your A items. Start there.
Can a small warehouse use ABC analysis? Yes. Even a 10-person operation benefits from knowing which SKUs drive most of the revenue. You do not need special software to run a basic ABC sort. A spreadsheet and 12 months of sales history are enough to start.
Does QuickBooks classify inventory automatically? QuickBooks tracks quantities and costs but does not apply ABC or functional classification on its own. You need add-ons or a purpose-built inventory layer to get that logic without building it by hand in a spreadsheet.
How often should inventory classes be reviewed? Review A items every month, B items every quarter, and C items at least twice a year. Demand changes, and a classification that was right in January may be wrong by June.
What is the difference between safety stock and cycle stock? Cycle stock is what you sell through between orders. Safety stock is the extra buffer you hold in case a supplier runs late or demand spikes. Both need a defined number for each SKU, or your reorder logic will be inconsistent.
What is MRO inventory? MRO stands for maintenance, repair, and operations. These are supplies that keep your warehouse running, like pallet wrap and printer labels, but are never sold to a customer. They need their own category so they do not distort your sales-velocity data.
If your team is running on QuickBooks plus spreadsheets and the classification system lives mostly in one person's head, the practical next step is a connected inventory layer that enforces the rules you already know. The Software Society builds custom workflow systems aligned to how your operation actually works, without pushing you into a new ERP or away from the tools that already serve you. Reach out to talk through what consistent, team-wide inventory classification would look like for your business.
Frequently asked questions
What is the simplest inventory classification method to start with?
ABC analysis using your existing sales data is the easiest entry point. Sort your SKUs by revenue over the last 12 months. The top 20% are your A items. Start there before adding more complex functional categories.
What is the difference between safety stock and cycle stock?
Cycle stock is the inventory you sell through between replenishment orders. Safety stock is the extra buffer you hold to cover a late supplier shipment or an unexpected demand spike. Both need a defined number per SKU, or your reorder points will be inconsistent.
What is MRO inventory and why does it matter?
MRO stands for maintenance, repair, and operations. These are supplies that keep your warehouse running, such as pallet wrap, printer labels, and forklift batteries. They are never sold to customers but running out of them can stop your operation. Track them in a separate category so they do not skew your sales-velocity data.
How does ABC analysis inventory classification work?
ABC analysis splits your SKUs into 3 tiers. Class A covers the roughly 20% of items that drive about 80% of your revenue. Class B covers the middle tier with moderate value and movement. Class C covers the long tail of slow-moving or low-value items. Each tier gets a different count frequency and reorder approach.
Can a small warehouse use inventory classification methods like ABC analysis?
Yes. Even a 10-person operation benefits from knowing which SKUs drive most of the revenue. A basic ABC sort needs only a spreadsheet and 12 months of sales history. You do not need enterprise software to start.
Does QuickBooks handle inventory classification on its own?
QuickBooks tracks quantities and costs but does not apply ABC analysis, flag dead stock, or set safety stock targets automatically. A purpose-built inventory layer on top of QuickBooks adds that logic without requiring a full system migration.
How often should inventory classes be reviewed?
Review Class A items every month, Class B items every quarter, and Class C items at least twice a year. Demand shifts over time, and a classification that was accurate in January may be wrong by June.
Start with a free first look
A 30 minute call, your operation mapped, and a clear picture of what we would build. No obligation and nothing to install.
Book a callRelated guides
The rest of this guide, for the parts of the job this page does not cover.
Guides
- Excess Inventory
- Closed for Inventory
- Multi Location Inventory Management Software
- Inventory Management for Multiple Locations
- Costing Inventory
- Is Inventory a Long-term Asset
- Inventory Management System for Manufacturing
- Inventory Fixed Assets
- Inventory Management Pics
- Excel Inventory Template
- Push and Pull Inventory
- Consumable Inventory
- B2b Inventory Management
- Jewelry Inventory Management
- Dental Inventory Management
- The Objective of Inventory Management is To
- Qr Code for Inventory Management
- Inventory Metrics
- Inventory Formulas
- Healthy Inventory
- Additional Inventory