


Inventory Formulas
Inventory formulas are math equations that tell you when to order, how much to order, and how much your stock is costing you. The core ones are reorder point, safety stock, economic order quantity, inventory turnover, and fill rate. Each formula uses data you already have. This article shows you how to run each one and what to do with the result.
Reviewed September 2026. Figures are worked from the assumptions stated beside them, so you can substitute your own and the arithmetic still holds.
Reviewed and updated: June 2025
Book a callWhy Inventory Formulas Matter for Distributors and Warehouses
Guesswork is expensive. Order too much and cash sits on a shelf. Order too little and you miss a sale. Inventory formulas turn the data you already collect into decisions you can defend.
Most small distributors already track sales, costs, and buy orders in QuickBooks or Excel. The data is there. The formulas just connect it. This article is a plain-language reference, not a math textbook. Every formula is shown with a real example, and every variable is explained in everyday words.
We build it for your operation, and the first look is free
If you would rather not compare products, describe how your operation already works and we build the system around it.
No build cost. You see it running on your own process first, and the monthly subscription starts only once it is live.
Book a callReorder Point Formula
The reorder point is the stock level that triggers a new buy order. When your count hits this number, it is time to buy.
Formula: Reorder Point = (Average Daily Usage × Lead Time) + Safety Stock
Example: A wholesale distributor sells 50 units per day of a product. The supplier takes 7 days to deliver. Safety stock is 100 units. Reorder point = (50 × 7) + 100 = 450 units. When stock drops to 450, place the order.
Set this number too high and you carry excess stock. Set it too low and you run out before the delivery arrives. GS1, which publishes the barcode standards that power scan-based inventory counts, notes that accurate item spotting is the foundation of any reliable replenishment system. You can read their standards at gs1.org. Reorder point math is only as good as the counts feeding it.
How Do I Calculate Safety Stock for My Warehouse?
Safety stock is the buffer you keep on hand to cover demand spikes or late supplier deliveries. Without it, any variation in demand or lead time causes a stockout.
Formula: Safety Stock = (Maximum Daily Usage − Average Daily Usage) × Maximum Lead Time
Example: A fulfillment center averages 80 units sold per day but peaks at 120. The supplier's longest delivery has been 10 days. Safety stock = (120 − 80) × 10 = 400 units.
For fulfillment centers with variable demand, this number is not optional. Skipping it means a single bad week wipes out your buffer. The formula is simple, but the discipline of updating it when your supplier changes lead times is what makes it work. Review your safety stock inputs every time a supplier relationship or demand pattern changes.
Economic Order Quantity Formula
EOQ, or economic order quantity, is the ideal order size that balances what it costs to place an order against what it costs to hold inventory.
Formula: EOQ = √(2 × Annual Demand × Ordering Cost ÷ Holding Cost per Unit)
Here is what each variable means in plain terms:
- Annual Demand: total units you expect to sell in a year
- Ordering Cost: the cost of placing one buy order, including staff time and shipping setup
- Holding Cost per Unit: what it costs to store one unit for a year, including warehouse space, insurance, and tied-up cash
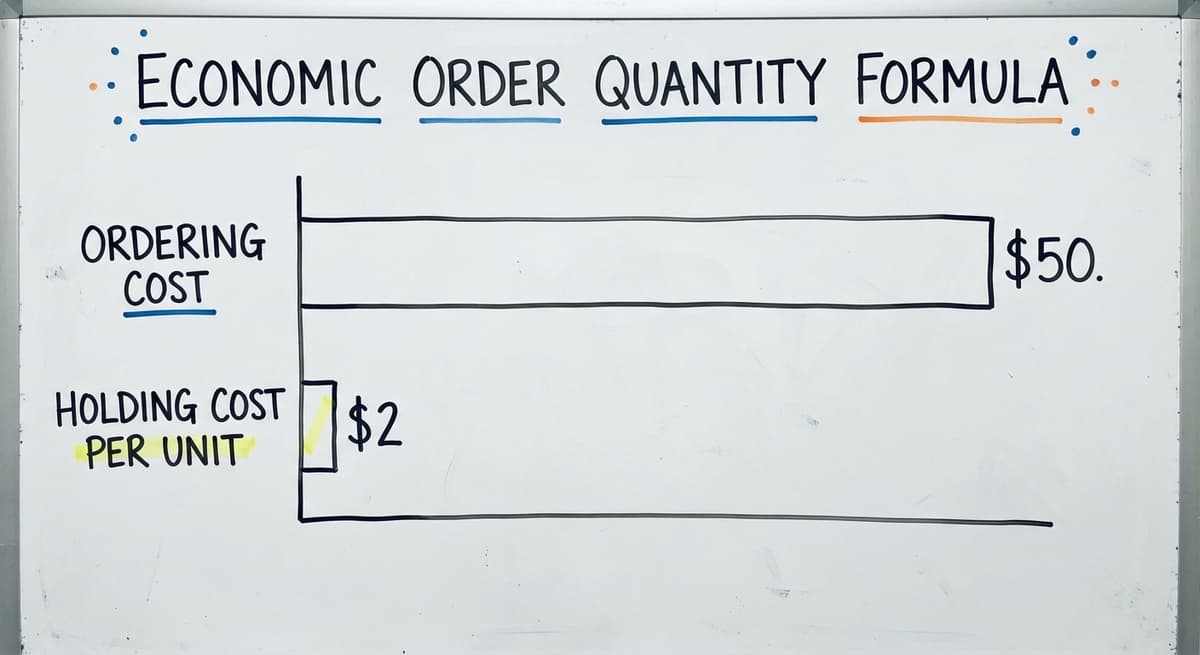
Example: Annual demand is 10,000 units. Ordering cost is $50. Holding cost is $2 per unit. EOQ = √(2 × 10,000 × 50 ÷ 2) = √500,000 = 707 units per order.
EOQ helps you avoid both over-ordering, which inflates carrying costs, and under-ordering, which drives up ordering frequency.
What the EOQ Formula Assumes
EOQ assumes demand is steady and costs stay fixed. That is rarely true in distribution. Supplier pricing changes, freight costs shift, and demand spikes around holidays.
Use EOQ as a starting point, not a final answer. It works well for stable, high-volume SKUs. For seasonal products, the formula gives a distorted result if you run it once and forget it. Seasonal businesses should recalculate EOQ each quarter using that season's actual demand and current ordering costs.
The comparison is easier when one option is built for you
Off-the-shelf means fitting your process to the software. We do it the other way round, and the first look costs nothing.
Book a callInventory Turnover Formula
Inventory turnover measures how many times your stock is sold and replaced in a set period.
Formula: Inventory Turnover = Cost of Goods Sold ÷ Average Inventory Value
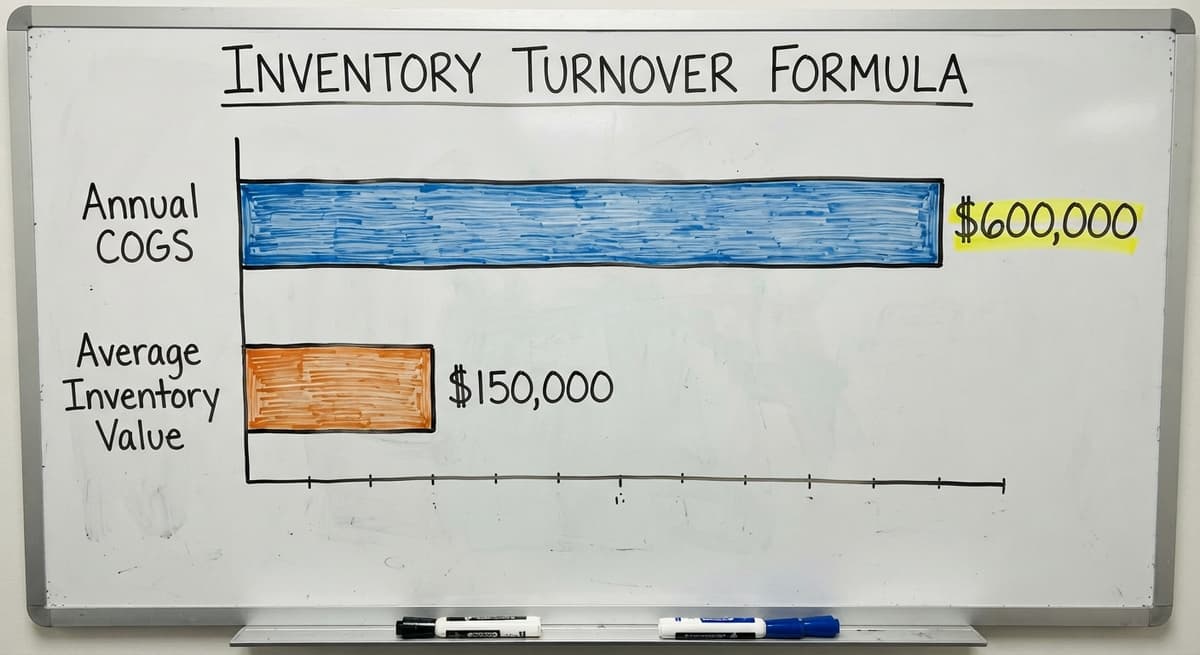
Example: Annual COGS is $600,000. Average inventory value is $150,000. Turnover = 600,000 ÷ 150,000 = 4. Stock turns over 4 times per year.
A high turnover ratio means products move fast and cash cycles back quickly. A low ratio signals slow-moving stock or over-buying. For a wholesale distributor, the right turnover target depends on the product category. Perishables should turn much faster than industrial parts.
QuickBooks already holds your COGS and inventory value. You do not need new data. You just need to pull those two numbers and divide them. The IRS agrees that tracking inventory value matters: IRS Publication 538 states, "To figure taxable income, you must value your inventory at the beginning and end of each tax year." (IRS Publication 538) Turnover is both a business health signal and a legal input.
Days Inventory Outstanding Formula
Days inventory outstanding (DIO) is the average number of days your stock sits before it sells.
Formula: DIO = (Average Inventory ÷ Cost of Goods Sold) × Number of Days in Period
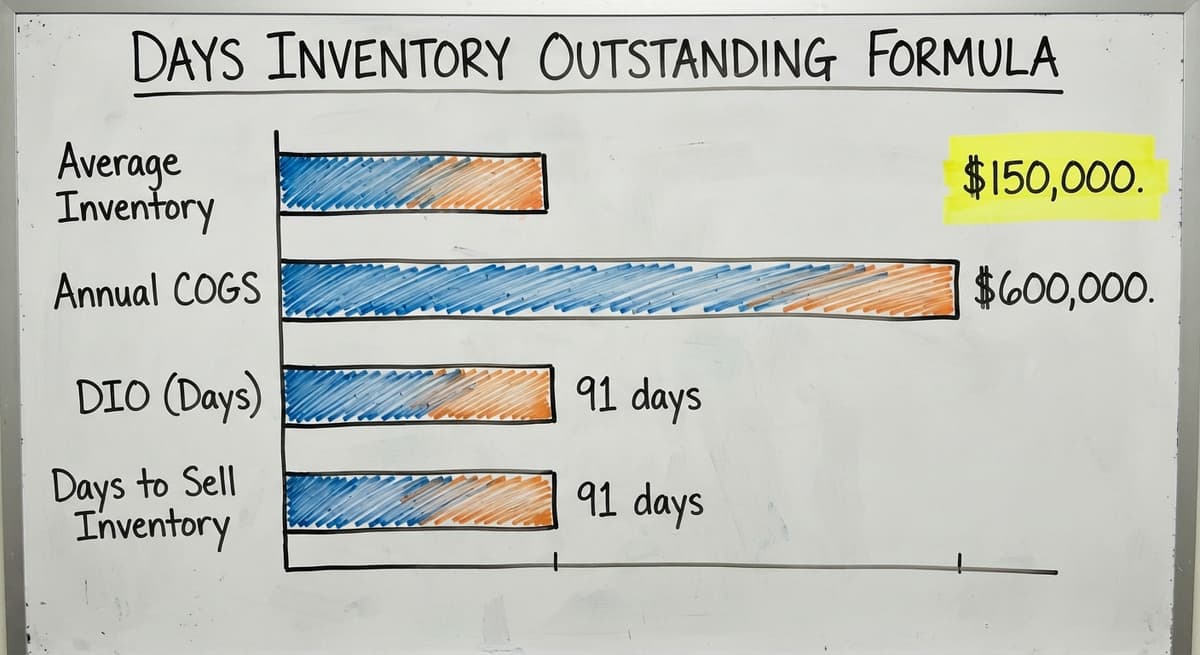
Example: Average inventory is $150,000. Annual COGS is $600,000. DIO = (150,000 ÷ 600,000) × 365 = 91 days.
For small wholesale operations, DIO connects directly to cash flow. Stock sitting on a shelf for 91 days is cash you cannot spend for 91 days. A lower DIO means faster cash recovery. If your DIO is climbing, check whether your reorder point is set too high or whether certain SKUs have stopped moving. DIO is the cash-flow version of the turnover story.

Carrying Cost of Inventory Formula
Carrying cost is the total expense of holding inventory over a period. Most operators undercount it because the costs are spread across several line items.
Formula: Carrying Cost = Average Inventory Value × Carrying Cost Rate
The carrying cost rate usually includes:
- Warehouse space and utilities
- Insurance on stored goods
- Obsolescence and shrinkage
- Opportunity cost of the cash tied up in stock
Example: Average inventory value is $200,000. Carrying cost rate is 25%. Annual carrying cost = $200,000 × 0.25 = $50,000.
That $50,000 does not show up as a single line on a simple profit and loss statement. It is buried in rent, insurance, and write-offs. Running this formula once a year reveals the true cost of holding inventory and often changes how buyers think about order size. The US Census Bureau's Monthly Wholesale Trade data tracks national inventory-to-sales ratios, which can help you benchmark whether your carrying costs are in a normal range for your sector.
What Is Sell-Through Rate and How Do I Calculate It?
Sell-through rate is the percentage of received inventory that sells within a set period. It tells you how fast a SKU moves relative to what you brought in.
Formula: Sell-Through Rate = (Units Sold ÷ Units Received) × 100
Example: You received 500 units of a product last month and sold 350. Sell-through rate = (350 ÷ 500) × 100 = 70%.
A low sell-through rate, say below 50% over 30 days, flags a slow-moving SKU before it becomes dead stock. For fulfillment centers managing dozens of product lines, this formula is a fast triage tool. Run it monthly on your bottom-performing SKUs and you will catch problems while there is still time to discount, bundle, or return the goods. Sell-through rate is your early warning system for dead stock.
See it running on your own process first
No build cost. The subscription starts once it is live and doing the job, not before.
Book a call
Stock-to-Sales Ratio Formula
The stock-to-sales ratio shows how much inventory you have on hand compared to what you are selling in the same period.
Formula: Stock-to-Sales Ratio = Inventory on Hand ÷ Sales for the Period
Example: You have $300,000 of inventory on hand. Sales for the month are $100,000. Stock-to-sales ratio = 3.0.
This ratio guides purchasing without over-complicating the process. A ratio of 3.0 means you are holding 3 months of sales in stock. The US Census Bureau publishes monthly inventories-to-sales ratios for wholesale firms, which gives you a national benchmark to compare against.
Stock-to-sales ratio differs from inventory turnover in one key way. Turnover uses cost of goods sold; stock-to-sales uses revenue. Both matter, but they answer slightly different questions. Turnover measures efficiency. Stock-to-sales guides near-term buying decisions.
Fill Rate Formula
Fill rate is the percentage of customer orders you ship complete from available stock, with no backorder.
Formula: Fill Rate = (Orders Shipped Complete ÷ Total Orders Placed) × 100
Example: 180 of 200 orders shipped complete. Fill rate = (180 ÷ 200) × 100 = 90%.
For wholesale distributors, fill rate is a direct service metric. Customers notice when orders arrive short. A fill rate below 95% is worth investigating. The FTC's Mail, Internet, or Telephone Order Merchandise Rule needs sellers to ship when promised or notify the customer. Accurate stock counts protect you legally and operationally.
A low fill rate almost always points back to a reorder point or safety stock problem. Fix the replenishment math and fill rate tends to recover on its own.

Gross Margin Return on Inventory Investment Formula
GMROII (gross margin return on inventory investment) measures the gross profit you earn for every dollar tied up in inventory.
Formula: GMROII = Gross Margin ÷ Average Inventory Cost
Example: Gross margin is $120,000. Average inventory cost is $200,000. GMROII = 120,000 ÷ 200,000 = 0.60, or 60 cents of gross profit per dollar of inventory.
GMROII is more useful than turnover alone when you are comparing product lines. A SKU can turn fast but carry a thin margin, making it a poor use of shelf space. Another SKU might turn slowly but generate strong margin dollars. Use GMROII to decide which products deserve more buying dollars and which ones should be trimmed from the catalog.
How to Use These Formulas Together
No single formula tells the full story. Each one answers a different question, and they work best as a set.
Here is a practical decision flow for an operations manager:
- Start with inventory turnover and DIO to spot which SKUs are moving slowly and tying up cash.
- Check sell-through rate on the slow movers to confirm the pattern and decide whether to cut orders or discount.
- Run reorder point and safety stock on your top SKUs to make sure replenishment is set correctly.
- Use carrying cost to size the financial impact of any overstock you find.
- Review fill rate to confirm that replenishment changes are improving customer service.
This sequence moves from diagnosis to fix to confirmation. You do not need to run all 9 formulas every week. Run turnover and DIO monthly, reorder point quarterly, and GMROII when you are reviewing the product mix.

Where the Data for These Formulas Comes From
Most of the inputs for these inventory formulas already live in your systems. QuickBooks holds COGS and inventory value. Buy orders show lead times and ordering costs. Receiving logs track units received. Sales reports give you daily and monthly usage.
The challenge is not finding the data. It is pulling it together fast enough to act on it. Many small distributors calculate these formulas manually in Excel. That works, but it is slow. A staff member spending 6 hours a week pulling data and updating spreadsheets at $22 an hour costs about $6,864 a year in labor alone, before accounting for errors. The Bureau of Labor Statistics reports median wages for stock and inventory clerks, which you can use to run this math for your own team.
Not sure this is the right shape for your operation
Describe how the work runs today. We map it on a call and show you what it would look like built around that, before you spend anything.
Book a callWhen Do Manual Spreadsheet Formulas Start to Break Down?
Manual formulas break down when SKU count, warehouse locations, or order volume grows faster than the spreadsheet can keep up. This is a growth problem, not a failure of effort.
The symptoms are recognizable:
- Formulas go weeks without being updated because no one has time
- Different staff members use different versions of the same spreadsheet
- A wrong number in one cell causes a stockout or an overstock that takes weeks to unwind
- Reorder point calculations exist for top SKUs but not for the long tail
The NIST Manufacturing Extension Partnership offers vendor-neutral guidance on when manual supply chain processes become a constraint on growth. The threshold is different for every operation, but the signal is the same: when errors cost more than a software solution would, the spreadsheet has done its job and it is time to move on.

How Inventory Software Automates These Formulas
Purpose-built inventory management software calculates reorder points, safety stock, turnover, fill rate, and carrying cost automatically using live data. You set the variables once. The system updates the outputs as transactions happen.
The best systems pull data from QuickBooks rather than replacing it. Your accounting stays where it is. The inventory layer sits on top and reads from the same source of truth. This matters for small and mid-size distributors because a full ERP migration is expensive, disruptive, and often unnecessary.
Custom inventory software built around your existing operations avoids that disruption entirely. Instead of forcing your process into a generic system, the software reflects how your warehouse actually works. Reorder point and replenishment automating runs in the background. Your team sees alerts, not spreadsheets. The goal is fewer decisions made from memory and more decisions made from current numbers.
What to Look for in Software That Handles Inventory Formulas
Not all inventory software is built for small and mid-size distributors. Here is what to check before you commit:
- QuickBooks integration that reads COGS and inventory value without manual exports
- A dashboard that shows formula outputs, not just raw data, so your team can act without running the math themselves
- Editable variables for lead time, safety stock, and ordering cost that any team member can update without calling IT
- Transparent formula logic so you can see how a reorder point was calculated, not just the number it produced
- Scalability for growing SKU counts and extra warehouse locations without a platform change
Avoid systems that lock formula logic inside a black box. If you cannot see how a number was calculated, you cannot trust it or explain it to a supplier. Small and mid-size operations need inventory software for small distributors that grows with them. Enterprise tools built for 1,000-person teams add complexity without adding value at your scale. The right software makes your existing data work harder, not your team.

Quick Reference: Inventory Formulas at a Glance
Bookmark this section and return to it when you need a fast reminder.
| Formula | Equation | What It Tells You |
|---|---|---|
| Reorder Point | (Avg Daily Usage × Lead Time) + Safety Stock | When to place a new order |
| Safety Stock | (Max Daily Usage − Avg Daily Usage) × Max Lead Time | Buffer against demand spikes and late deliveries |
| EOQ | √(2 × Annual Demand × Ordering Cost ÷ Holding Cost) | Ideal order size to balance costs |
| Inventory Turnover | COGS ÷ Average Inventory Value | How fast stock cycles through |
| Days Inventory Outstanding | (Avg Inventory ÷ COGS) × Days in Period | How long stock sits before selling |
| Carrying Cost | Avg Inventory Value × Carrying Cost Rate | True cost of holding stock |
| Sell-Through Rate | (Units Sold ÷ Units Received) × 100 | How fast received stock sells |
| Stock-to-Sales Ratio | Inventory on Hand ÷ Sales for Period | Months of stock on hand vs. revenue |
| Fill Rate | (Orders Shipped Complete ÷ Total Orders) × 100 | Service level from available stock |
| GMROII | Gross Margin ÷ Average Inventory Cost | Profit earned per dollar of inventory |
Next Steps for Distributors Ready to Put These Formulas to Work
Start with one formula this week. Pick reorder point. Pull your average daily usage and lead time for your top 20 SKUs from QuickBooks and your buy orders. Add your safety stock. Write the numbers down.
If that data-gathering step takes more than a few hours, that is useful information. It means the inputs are scattered, and a software solution would pay for itself quickly in time saved and errors avoided.
When you are ready to stop calculating manually, our team at The Software Society can show you how custom inventory software built around your existing operation automates these formulas using live data, without replacing QuickBooks or forcing a disruptive migration. Talk with us about what a system built for your warehouse would actually look like.
Frequently asked questions
What is EOQ and formula?
EOQ stands for economic order quantity. It is the order size that balances what it costs to place an order against what it costs to hold the inventory you receive. The formula is: EOQ = √(2 × Annual Demand × Ordering Cost ÷ Holding Cost per Unit). For example, if annual demand is 10,000 units, ordering cost is $50, and holding cost is $2 per unit, EOQ = √500,000 = 707 units per order. Use EOQ as a starting point for stable SKUs, and recalculate it whenever demand or costs shift significantly.
What are the four main types of inventory?
The four main types are raw materials (inputs not yet used in production), work in progress (items partially through a manufacturing process), finished goods (products ready to sell), and MRO inventory (maintenance, repair, and operations supplies that support the business but are not sold directly). Most wholesale distributors and fulfillment centers deal mainly with finished goods and MRO. The inventory formulas in this article apply most directly to finished goods.
What is the formula for finding inventory?
The basic formula for calculating ending inventory is: Ending Inventory = Beginning Inventory + Buys − Cost of Goods Sold. This is the accounting identity that underlies most inventory valuation. IRS Publication 538 needs businesses to value inventory at the start and end of each tax year using this logic. In practice, your QuickBooks file calculates this automatically as transactions are posted, which is why it is the right data source for all the working formulas covered in this article.
What is the best rule for valuing inventory?
There is no single best rule. The IRS recognizes several methods: FIFO (first in, first out), LIFO (last in, first out), and weighted average cost. FIFO is the most common for distributors because it matches the physical flow of most products and tends to reflect current market value more correctly. LIFO can reduce taxable income when costs are rising, but it is not permitted under international accounting standards. The right choice depends on your product type, tax situation, and whether you have international reporting requirements. Talk with your accountant before switching methods.
How do I calculate inventory turnover for my distribution business?
Divide your cost of goods sold by your average inventory value for the same period. Average inventory is your beginning inventory value plus your ending inventory value, divided by 2. Both numbers live in QuickBooks. A result of 4 means your stock turns over 4 times per year, or roughly every 91 days. Compare your result to the US Census Bureau's monthly wholesale inventories-to-sales ratios to see how you stack up against the broader market.
When does it make sense to stop calculating inventory formulas manually in Excel?
The clearest signal is when errors in your spreadsheets cause real problems: a stockout because a reorder point was not updated, or an overstock because two people were working from different versions of the same file. A secondary signal is time cost. If pulling and updating formula inputs takes several hours a week, that labor cost often exceeds the monthly cost of purpose-built inventory software. The transition makes financial sense before the errors become chronic, not after.
What is GMROII and how is it different from inventory turnover?
GMROII (gross margin return on inventory investment) measures how much gross profit you earn for every dollar tied up in inventory. Inventory turnover measures how many times stock cycles through in a period. Turnover tells you how fast products move. GMROII tells you whether moving them fast is actually profitable. A product can have high turnover and low GMROII if the margin is thin. Use both together when deciding which SKUs deserve more shelf space and buying dollars.
Where does the data for inventory formulas come from in a small distribution operation?
Most inputs come from QuickBooks (COGS, inventory value, sales history), buy orders (lead times, ordering costs), and receiving logs (units received per SKU). Daily usage figures come from sales reports. The data is rarely missing. The common problem is that it lives in separate places and takes time to pull together. Many small distributors solve this with Excel in the short term and move to integrated inventory software when the manual process becomes a bottleneck.
Start with a free first look
A 30 minute call, your operation mapped, and a clear picture of what we would build. No obligation and nothing to install.
Book a callRelated guides
The rest of this guide, for the parts of the job this page does not cover.
Guides
- Inventory Management for Multiple Locations
- Inventory Management System for Manufacturing
- Excel Inventory Template
- Jewelry Inventory Management
- Dental Inventory Management
- Qr Code for Inventory Management
- Hvac Inventory Management Software
- Warehouse Inventory Management Software
- Warehouse Inventory Tracking Software
- Warehouse Inventory Management Systems
- Quickbooks Inventory Management Software
- Warehouse Inventory Systems
- Inventory and Warehouse Management Software
- Custom Inventory Management Software
- Warehouse Inventory Management System
- Retail Inventory Management
- Warehouse Inventory Software Programs
- Manufacturing Inventory Management Software
Common questions
- Why is Warehousing and Inventory Management Important
- How to Manage Inventory in a Warehouse
- What is the Best Warehouse Inventory Management System?
- What is the Difference Between Warehousing and Inventory Management
- How to Create a Barcode System for Inventory
- How to Keep Track of Inventory in Warehouse