


Healthy Inventory
Healthy inventory means having the right products, in the right quantities, ready when customers need them. For a small wholesale distributor or warehouse, that definition is practical and measurable. This guide, reviewed July 2025, walks through the signs of unhealthy inventory, the metrics that matter, and the steps you can take now to fix it without buying a large ERP or replacing QuickBooks.
Book a callWhat Healthy Inventory Actually Means
Healthy inventory is not the same as a lot of inventory. A full warehouse can still be unhealthy if the wrong items fill the shelves while the fast-moving products run out. The goal is balance: enough stock to fill orders, not so much that cash sits idle on pallets.
Reviewed September 2026. Figures are worked from the assumptions stated beside them, so you can substitute your own and the arithmetic still holds.
Many owners assume that buying more protects the business. It can actually hurt it. Overbuying ties up working capital, fills space, and creates dead stock that is hard to move.
The good news is that healthy inventory is achievable for operations with 5 to 100 people. You do not need a Fortune 500 budget or a large IT team. You need accurate data and a few consistent habits.
We build it for your operation, and the first look is free
If you would rather not compare products, describe how your operation already works and we build the system around it.
No build cost. You see it running on your own process first, and the monthly subscription starts only once it is live.
Book a callWhy Inventory Health Matters for Wholesale Distributors and Warehouses
Inventory health connects directly to cash flow, customer satisfaction, and how smoothly your team works each day. When inventory is unhealthy, the costs show up fast.
Stockouts mean lost orders and frustrated customers. Overstock ties up cash you could use elsewhere. Dead stock, meaning items that have not moved in 90 days or more, eats warehouse space and working capital at the same time. Missed or late orders put you at legal risk: the US Federal Trade Commission needs sellers to ship when promised or notify the customer and offer a refund.
Accurate counts are also a tax obligation. The IRS states in Publication 538: "To figure taxable income, you must value your inventory at the beginning and end of each tax year."
For any scan-based count, GS1 notes that barcode standards are the foundation that makes product spotting reliable across the supply chain.
Is My Inventory Unhealthy? Five Signs to Check Right Now
If any of these describe your operation, your inventory health needs attention. Count how many apply.
- Frequent stockouts leave customers waiting and damage repeat business.
- Excess dead stock occupies shelf space and blocks cash from cycling back into useful product.
- Inaccurate counts mean your system says you have 50 units but the shelf holds 32.
- Slow order fulfillment forces your team to search, substitute, or apologize.
- Reliance on printed sheets or spreadsheets for daily stock decisions means your data is always a step behind reality.
If 3 or more of these apply, the problem is systemic, not situational.
Stockouts and Dead Stock: Two Sides of the Same Problem
Stockouts are the most visible symptom. A customer calls for a product and you do not have it. That call costs you the order and, over time, the relationship. Stockouts usually signal a broken reorder point, not just a supply chain delay. When stock levels are tracked in Excel or email, the warning comes too late.
Dead stock is the quieter drain. Items that have not sold in 90 or more days still cost you space, insurance, and carrying cost. Dead stock builds up when purchasing decisions are made without real-time sales data. A buyer orders based on last quarter's feel rather than this week's numbers, and slow movers pile up while fast movers run short. The fix starts with knowing which SKUs have not moved and why.
The comparison is easier when one option is built for you
Off-the-shelf means fitting your process to the software. We do it the other way round, and the first look costs nothing.
Book a callKey Metrics That Measure Inventory Health
Tracking inventory health needs a small set of numbers. Each one tells a different part of the story.
- Inventory turnover rate measures how many times you sell through your average stock in a year. A higher number generally means healthier cash flow.
- Days on hand tells you how many days of supply you are holding at the current sales pace. High days on hand often signals overstock.
- Fill rate is the share of orders shipped complete on the first try. A low fill rate is usually the first number your customers feel.
- Shrinkage rate tracks the gap between what your system says you have and what a physical count finds.
- Carrying cost is the total cost of holding inventory: space, insurance, labor, and tied-up capital.
These numbers are hard to track when data lives across 3 spreadsheets, an email inbox, and a QuickBooks file that nobody updates in real time.
Inventory Turnover and Fill Rate: The Two Numbers That Tell the Most
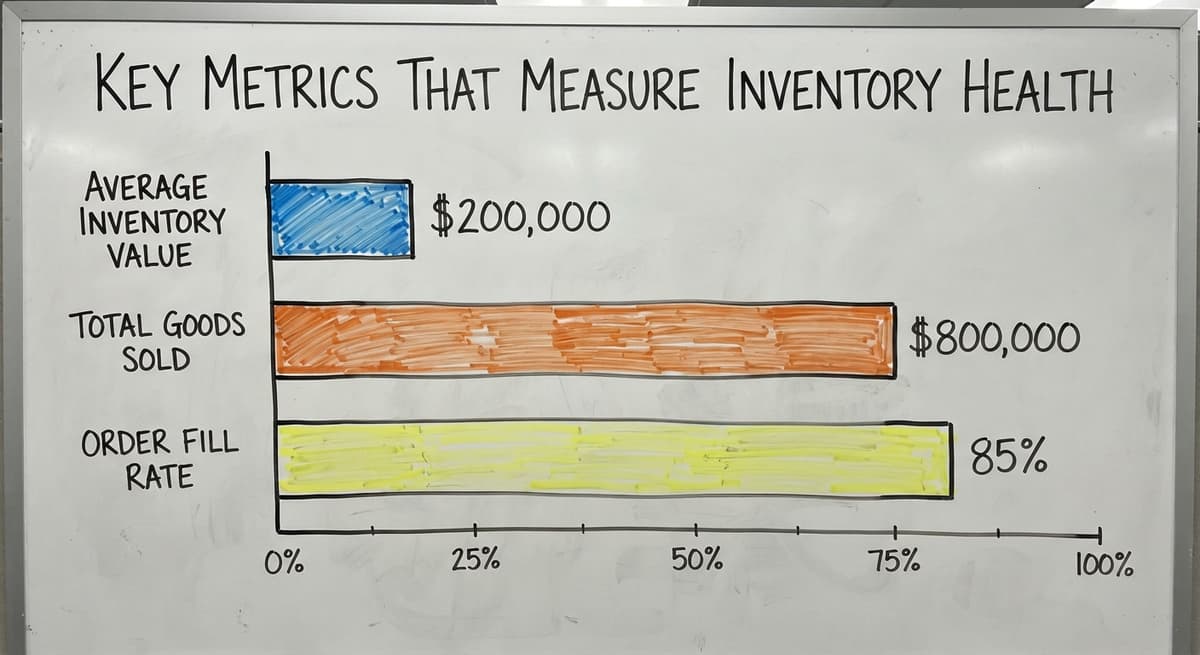
Inventory turnover equals cost of goods sold divided by average inventory value. A wholesale distributor carrying $200,000 in average inventory and selling $800,000 in goods at cost turns inventory 4 times a year. A turnover below 3 in most wholesale categories suggests too much stock sitting too long.
Fill rate is the share of orders shipped complete on the first attempt. A fill rate of 85% means 15 out of every 100 orders go out short or late. Customers notice that before you do. Low fill rate usually traces back to inaccurate reorder points or stock counts that lag behind actual movement.

Does QuickBooks Handle Inventory on Its Own?
QuickBooks is a solid accounting tool, and most small distributors are right to keep using it. The problem is what it was not built to do. QuickBooks tracks what you paid for inventory and what you sold. It does not give you real-time stock visibility across multiple locations, automated reorder alerts, or a clear view of what is on the warehouse floor right now.
The answer is not to replace QuickBooks. The answer is to add a layer on top that handles real-time inventory tracking while QuickBooks keeps doing the accounting. Many small distributors waste months evaluating full ERP replacements when what they actually need is a focused inventory system that connects to the tools already in place.
The Spreadsheet and Email Trap
The typical patchwork looks like this: QuickBooks for accounting, Excel for stock counts, email for buy orders, and printed sheets on the warehouse floor. Each tool works on its own. Together, they create gaps.
A stock count done Monday morning is out of date by Tuesday afternoon. A buy order sent by email does not update the spreadsheet until someone remembers to do it. Two people work from different versions of the same file.
This setup is common in 5-to-100-person operations. It is not a sign of failure. It is a sign that the business grew past what manual tools can handle. The gap between what the system says and what the warehouse holds is where money disappears.
See it running on your own process first
No build cost. The subscription starts once it is live and doing the job, not before.
Book a callWhat a Healthy Inventory System Looks Like in Practice
Picture a 12-person distribution center that ships industrial supplies. The warehouse manager opens a single screen each morning. Stock levels, reorder alerts, and open buy orders are all visible in one place. When a SKU drops below its reorder point, the system flags it automatically. The pick-and-pack team works from a live list, not a printed sheet from yesterday.
A supplier ships short on a Monday delivery. The system updates the affected SKU count at once. The sales team sees the shortage before a customer calls about it.
Real-time inventory visibility does not need a large operation. It needs one connected system where stock data, purchasing, and fulfillment update each other without a person in the middle manually moving numbers from one place to another. That is what separates a healthy inventory operation from one that runs on hope and habit.

Setting Reorder Points That Actually Work
A reorder point is the stock level that triggers a new buy order. It is the engine of healthy inventory because it removes the guesswork from buying decisions.
The formula is straightforward:
Reorder point = (average daily usage × supplier lead time) + safety stock
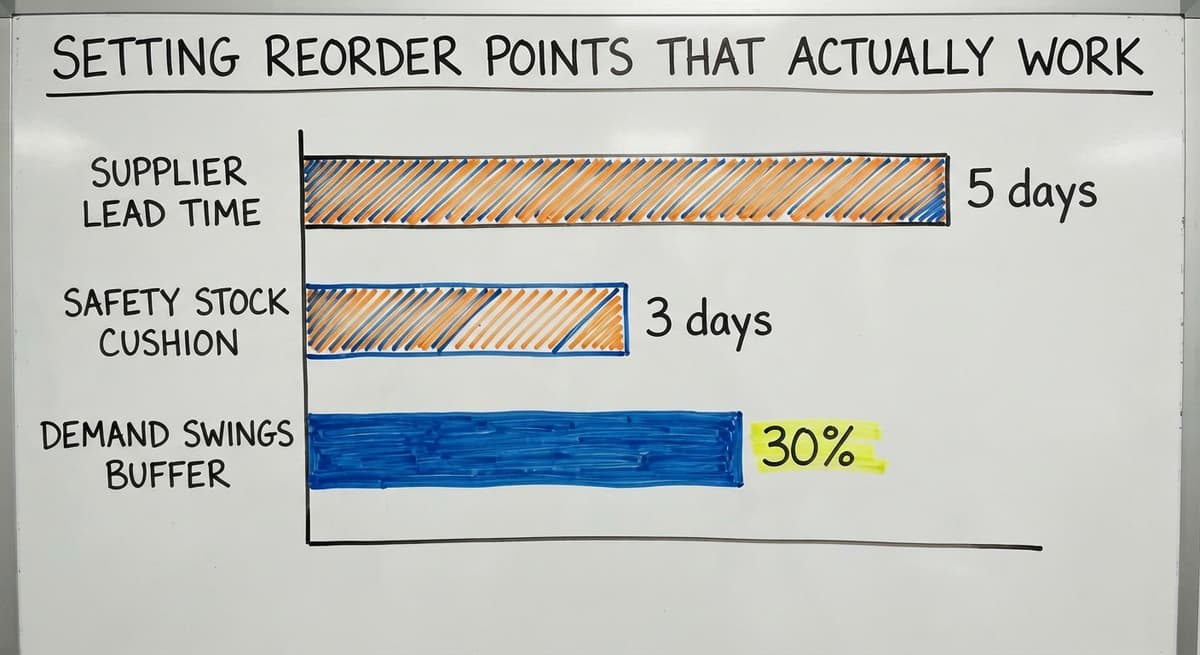
For example: you sell 20 units a day of a product, your supplier takes 5 days to deliver, and you want 3 days of buffer. Your reorder point is (20 × 5) + 60 = 160 units. When stock hits 160, the system alerts you to order.
Reorder points only work when your stock counts are accurate. A reorder point built on bad data fires too early or too late. The NIST Manufacturing Extension Partnership recommends regular process reviews to keep supply chain data reliable, which applies directly to how often you verify your counts.
Safety Stock: Your Buffer Against the Unexpected
Safety stock is the extra units you hold to cover demand spikes or supplier delays. To size it, multiply your maximum daily usage by your maximum lead time, then subtract your average daily usage multiplied by your average lead time.
If demand swings by 30% and your supplier occasionally runs a day late, you need more buffer than a supplier who delivers like clockwork. Carry too little and you stock out during a busy week. Carry too much and cash sits in product that is not moving. The right number sits between those two risks, and it should be reviewed when demand patterns or supplier performance change.
Should a Small Distributor Buy Custom Inventory Software or an Off-the-Shelf ERP?
Large ERP systems exist for a reason, but they are built for enterprise scale. They take 12 to 18 months to implement, need dedicated IT staff, and cost far more than most small distributors can absorb. Buying one to solve an inventory problem is like buying a semi-truck to make local deliveries.
Custom inventory software is a practical middle ground. A custom system is scoped to the workflows your operation already uses. It can sit on top of QuickBooks rather than replacing it, connect to your existing barcode scanners, and automate only the steps that are actually causing problems. A business with 20 employees does not need every feature a 2,000-person company uses.
Consider the labor cost alone: 2 people spending 10 hours a week on manual stock matching at $22 an hour costs $22,880 a year. A focused custom system that removes most of that work pays for itself quickly without the disruption of a full ERP rollout.
Not sure this is the right shape for your operation
Describe how the work runs today. We map it on a call and show you what it would look like built around that, before you spend anything.
Book a call
Steps to Start Improving Inventory Health Today
Improving inventory health does not need a big project. Start with these steps, in order.
- Audit current stock accuracy by counting your top 20 SKUs by revenue and comparing the physical count to what your system shows. The gap tells you how bad the data problem is.
- Identify your top dead-stock SKUs by pulling any item that has not moved in 90 days. Quantify the dollar value sitting idle.
- Document reorder points for your 10 fastest-moving items using the formula above. Even rough numbers beat no numbers.
- Map your current data flow from receiving to picking to billing. Mark every step where someone manually moves data from one tool to another.
- Evaluate where software closes the gaps by matching each manual step to a feature a connected system could handle automatically.
This is a starting point, not a full transformation. Small improvements in data accuracy compound quickly into fewer stockouts, less dead stock, and faster order fulfillment.
Common Mistakes That Damage Inventory Health
Lean teams fall into these traps easily. None of them signal a bad operation.
- Buying in bulk without demand data feels like savings but creates dead stock. The fix is to base order quantities on actual sales velocity, not supplier minimums.
- Skipping cycle counts lets count errors build up until a full physical count reveals a large gap. The fix is to count a rotating set of SKUs each week rather than waiting for year-end.
- Using systems that do not talk to each other means data is always out of sync. The fix is one connected system or a clear integration between the tools you already use.
- Relying on memory or tribal knowledge works until the person who holds it leaves. The fix is to document reorder points, supplier lead times, and count procedures in a place the whole team can access.
The pattern across all 4 mistakes is the same: decisions made without current, accurate data. Better data is the fix, not harder work.

Healthy Inventory Is an Ongoing Practice
Inventory health is not a project with an end date. It needs consistent habits: regular cycle counts, reorder points reviewed when demand shifts, and a weekly look at the numbers that matter.
The right software reduces the manual effort those habits need. When alerts fire automatically and counts update in real time, your team spends less time chasing data and more time acting on it.
Small, consistent improvements compound. A 5% gain in fill rate this quarter means fewer missed orders. A 10% reduction in dead stock next quarter means more cash available for fast-moving product. None of it needs a big system overhaul to start.

Ready to Build a Healthier Inventory Operation?
Healthy inventory is measurable, achievable, and does not need replacing QuickBooks or buying a large ERP. The gap between where most small distributors are and where they need to be is usually a data problem, not a people problem.
If your operation runs on a patchwork of spreadsheets, email, and printed sheets, a custom inventory software layer built around your existing workflow can close that gap without disrupting what already works.
Reach out for a straightforward conversation about your current setup. No pressure, no sales pitch: just a practical look at where the gaps are and what it would take to close them.
Frequently asked questions
What is the 80/20 rule in inventory?
The 80/20 rule in inventory, also called the Pareto principle, holds that roughly 80% of your sales come from 20% of your SKUs. In practice, this means a small number of products drive most of your revenue and deserve the closest attention for reorder points, safety stock, and count accuracy. The remaining 80% of SKUs need less frequent review but should still be monitored for dead stock.
Can you give me an example of an inventory?
A wholesale distributor of janitorial supplies might hold 400 active SKUs: paper towels, cleaning chemicals, trash liners, dispensers, and related items. Each SKU has a quantity on hand, a reorder point, and a supplier lead time attached to it. That collection of products, quantities, and purchasing rules is the inventory. Healthy inventory means those numbers are accurate and the reorder points are set correctly so the warehouse rarely runs out of fast movers or overstocks slow ones.
What is a personal health inventory?
A personal health inventory is a self-assessment tool used in wellness and healthcare contexts to evaluate an individual's physical, mental, and lifestyle health. It is unrelated to warehouse or business inventory management. If you landed here looking for that topic, a licensed healthcare provider or a reputable health organization website is the right resource.
What are the three key measures of inventory health?
The 3 most useful measures are inventory turnover rate, fill rate, and days on hand. Turnover shows how quickly you cycle through stock. Fill rate shows how often you ship orders complete on the first try. Days on hand shows how long your current supply would last at the current sales pace. Together, these 3 numbers tell you whether you are holding too much, too little, or the wrong mix of product.
Why is QuickBooks not enough for managing inventory on its own?
QuickBooks tracks accounting data well, but it was not built for real-time stock visibility, multi-location tracking, or automated reorder alerts. It shows what you paid and what you sold, not what is on the shelf right now. For a small distributor shipping daily, that lag creates stockouts and overbuying. Adding a focused inventory system on top of QuickBooks solves the gap without replacing the accounting tool your team already knows.
What is a reorder point and how do I set one?
A reorder point is the stock level that triggers a new buy order. Set it using this formula: multiply your average daily sales by your supplier lead time in days, then add your safety stock. For example, if you sell 15 units a day, your supplier takes 4 days to deliver, and you want 2 days of buffer stock, your reorder point is (15 x 4) + 30 = 90 units. When stock hits 90, order more.
Is custom inventory software a realistic option for a business with fewer than 100 employees?
Yes. Custom inventory software is often a better fit for small distributors than a large ERP because it is scoped to the workflows the business already uses. It can connect to QuickBooks, work with existing barcode scanners, and automate only the steps causing real problems. The cost is usually far lower than an ERP rollout, and the time to go live is measured in weeks rather than months.
What is the difference between dead stock and slow-moving stock?
Slow-moving stock sells, just at a lower rate than your fast movers. Dead stock has stopped selling entirely, usually defined as no sales in 90 days or more. Slow movers can be managed with adjusted reorder quantities or targeted promotions. Dead stock usually needs a markdown, a return to the supplier, or a write-off. Knowing which category a SKU falls into helps you act before slow-moving stock becomes dead stock.
Start with a free first look
A 30 minute call, your operation mapped, and a clear picture of what we would build. No obligation and nothing to install.
Book a callRelated guides
The rest of this guide, for the parts of the job this page does not cover.
Guides
- Classification of Inventory
- Excess Inventory
- Closed for Inventory
- Multi Location Inventory Management Software
- Inventory Management for Multiple Locations
- Costing Inventory
- Is Inventory a Long-term Asset
- Inventory Management System for Manufacturing
- Inventory Fixed Assets
- Inventory Management Pics
- Excel Inventory Template
- Push and Pull Inventory
- Consumable Inventory
- B2b Inventory Management
- Jewelry Inventory Management
- Dental Inventory Management
- The Objective of Inventory Management is To
- Qr Code for Inventory Management
- Inventory Metrics
- Inventory Formulas
- Hvac Inventory Management Software