

Push And Pull Inventory
Push inventory means ordering stock based on a forecast before demand arrives. Pull inventory means restocking only after a customer order triggers the need. Most small distributors use both without realizing it. This guide, reviewed July 2025, explains how each strategy works, when to use each, and how to manage both without replacing the tools you already rely on.
Book a callWhat Push and Pull Inventory Means
Push and pull inventory are two ways to decide when to order stock. Push is forecast-driven: you order before customers ask. Pull is demand-driven: you order because a customer just bought something.
Reviewed September 2026. Figures are worked from the assumptions stated beside them, so you can substitute your own and the arithmetic still holds.
A simple way to picture it: push is stocking shelves before shoppers arrive. Pull is restocking only the shelf space that sold.
Most wholesale distributors run a mix of both across their SKU catalog. They push on slow-moving seasonal items and pull on fast movers. The problem is that most do this informally, which means errors creep in quietly and no one notices until a stockout or an overstock lands on the books.
Formalizing which items follow which rule is the first step toward cleaner inventory replenishment.
We build it for your operation, and the first look is free
If you would rather not compare products, describe how your operation already works and we build the system around it.
No build cost. You see it running on your own process first, and the monthly subscription starts only once it is live.
Book a callHow Push and Pull Inventory Work in Practice
The Push Strategy
A push inventory strategy follows a forecast-driven buying cycle. You look at historical sales, upcoming seasons, and planned promotions. Then you place an order weeks or months ahead of when you expect demand.
A concrete example: a wholesale distributor orders winter gear in September, three months before the peak selling window. Lead times are long, and the supplier needs a minimum order quantity. Waiting for customer orders would mean arriving too late.
Why Scan Data Quality Matters for Push Forecasting
GS1, the global standards body behind supply chain barcodes, notes that accurate item spotting is the foundation of any count-based system. As GS1 explains, "barcodes are the most widely used automatic spotting technology in the world," and you can read their standards at gs1.org/standards/barcodes. That matters for push because a forecast is only as good as the sales history behind it, and bad scan data corrupts that history fast.
The risk with push: if your forecast is wrong, you carry excess stock and tie up cash.
The Pull Strategy
How does a pull inventory strategy actually work in a warehouse? A pull system fires a replenishment order only after a confirmed customer buy reduces on-hand stock below a set threshold, called a reorder point.
A fulfillment center is a good example. When a customer order is confirmed, the system checks on-hand quantity. If that quantity drops below the reorder point, a buy order is triggered automatically. No forecast needed.
Pull works well when products move fast and your supplier can ship within a few days. The risk is a demand spike. If 50 orders arrive in one afternoon and your reorder point was set for normal volume, you hit a stockout before the replenishment order can arrive.
Setting the right reorder point and safety stock level is what separates a pull system that works from one that fails at the worst moment.
Push vs. Pull Inventory: A Side-by-Side Comparison
Neither strategy is better in every situation. The right choice depends on your lead times, demand patterns, and storage costs. The table below compares both across 5 key dimensions.
| Dimension | Push | Pull |
|---|---|---|
| What triggers an order | A forecast | A customer buy |
| Cash tied up | Higher, stock held in advance | Lower, stock ordered on demand |
| Stockout risk | Low if forecast is accurate | Higher during demand spikes |
| Overstock risk | Higher if forecast is wrong | Low, since you only reorder what sold |
| Best fit | Long lead times, seasonal items | Fast movers, short replenishment cycles |
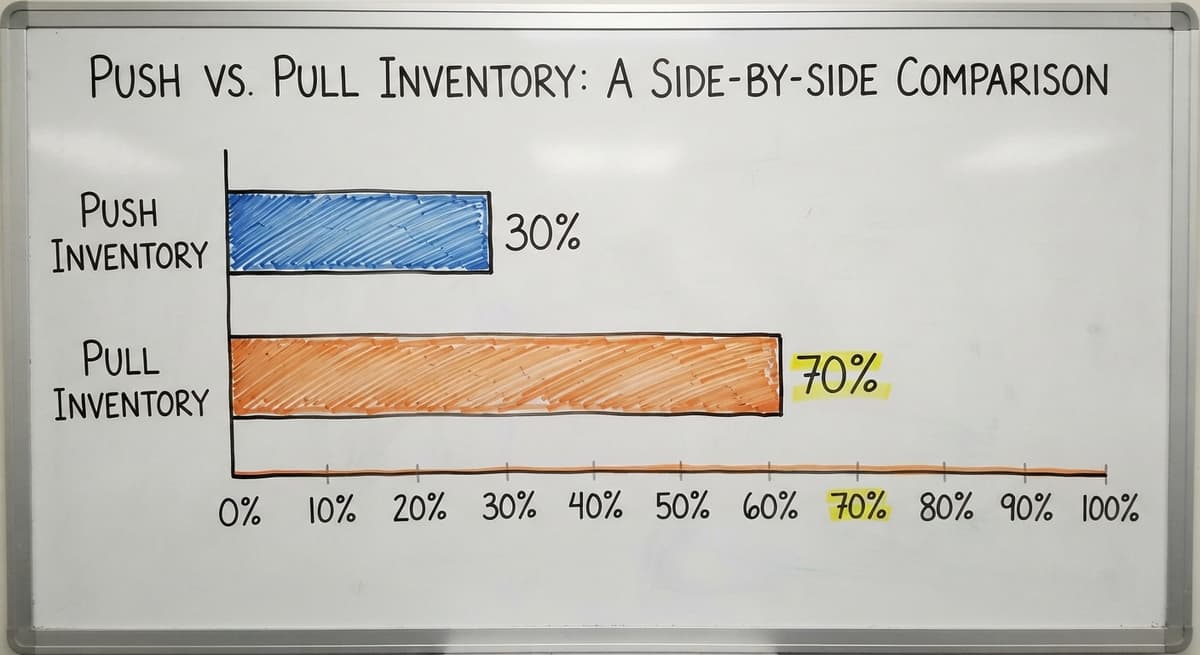
Context decides which strategy fits each SKU. A single distributor might correctly use push on 30% of their catalog and pull on the other 70%.
When to Use Push vs. Pull: Matching Strategy to SKU
Push Makes Sense When
A push inventory strategy fits best in these situations:
- Supplier lead times are long, making reactive buying impossible without risking a gap in supply
- Demand is seasonal or tied to a promotion you have already planned
- Your supplier offers volume discounts that reward large orders placed early
- The item has a stable, consistent sales history that makes forecasting reliable
For a small-to-midsize distributor, push is often the only practical option for import goods or items sourced from manufacturers with 8 to 12 week lead times. Waiting for a customer order before buying means you will miss the window every time.
The comparison is easier when one option is built for you
Off-the-shelf means fitting your process to the software. We do it the other way round, and the first look costs nothing.
Book a callPull Makes Sense When
A pull inventory strategy fits best in these situations:
- SKUs turn over fast and your supplier can replenish within a few days
- Demand is unpredictable or varies widely week to week
- Warehouse space is limited and holding extra stock carries a real cost
- You run a drop-ship model, where the supplier ships directly to your customer and you never touch the product
For a fulfillment center handling hundreds of SKUs with short replenishment cycles, pull keeps cash free and shelves right-sized. The discipline is in setting reorder points correctly and reviewing them when demand shifts.

Reorder Points, Safety Stock, and Demand Forecasting
The Mechanics Behind Pull
A reorder point is the on-hand quantity at which a new order fires. Safety stock is the buffer you hold above zero to absorb a demand spike or a supplier delay.
The formula is straightforward:
Reorder point = (average daily units sold x lead time in days) + safety stock
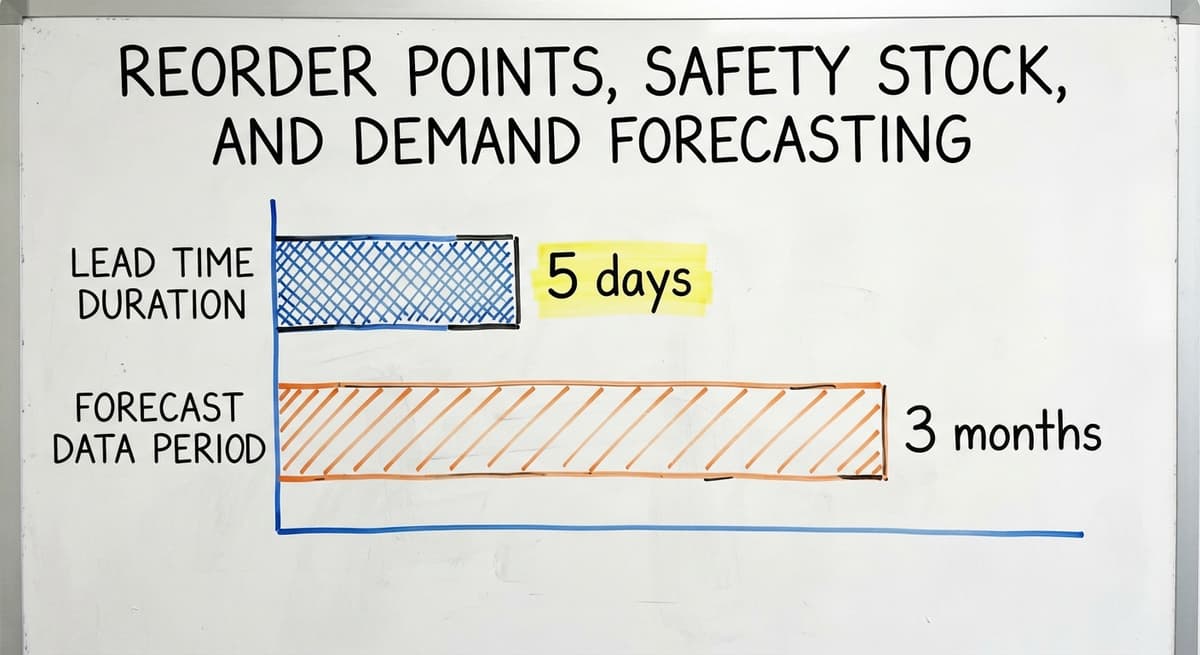
Example: you sell 10 units a day, your supplier takes 5 days to ship, and you want 20 units of buffer. Your reorder point is (10 x 5) + 20 = 70 units. When stock hits 70, you order.
Getting these numbers right matters more than the label you put on the strategy. A reorder point set once and never updated will drift out of alignment as demand changes. Review them at minimum every quarter, or any time a product's sales pattern shifts.
The Engine Behind Push
Push inventory relies on a forecast, which is a prediction of how much you will sell in a future period. Common inputs include historical sales data, seasonal patterns, planned promotions, and input from your sales team.
Small distributors often forecast informally, using gut feel and experience built over years. That works until it does not. Formalizing even a simple forecast, such as averaging the last 3 months of sales and adjusting for a known seasonal lift, improves push accuracy without requiring a statistics background.
The NIST Manufacturing Extension Partnership offers vendor-neutral guidance on building supply chain processes that are repeatable and measurable, which is exactly what a formalized forecast needs to be.
A documented forecast, even a simple one, beats a remembered one every time.
Does QuickBooks Handle Push and Pull Inventory?
QuickBooks can track on-hand quantities and lets you set reorder points, which gives you a basic pull signal. That is genuinely useful. What it does not do is support forecast-driven push replenishment. You can create buy orders manually, but QuickBooks will not auto-trigger them based on a demand signal or a projected shortfall.
The IRS is clear that inventory tracking is not optional. IRS Publication 538 states: "To figure taxable income, you must value your inventory at the beginning and end of each tax year." That means your counts need to be accurate, not just close. QuickBooks handles the financial side of that obligation well.

Where QuickBooks Falls Short on Inventory Decisions
The gap is in dynamic inventory decisions. QuickBooks tells you what you have. It does not tell you what you are about to run out of, or what you are sitting on too much of. You do not need to replace QuickBooks. A supplemental system that connects to it can handle the push and pull logic while QuickBooks stays as your accounting source of truth.
See it running on your own process first
No build cost. The subscription starts once it is live and doing the job, not before.
Book a callWhy Managing Push and Pull in Excel Breaks Down
Spreadsheets are a natural first tool for tracking reorder points and forecast data. They break down in predictable ways as the operation grows.
- Spreadsheets do not alert you when a pull trigger fires. Someone has to open the file and check.
- Forecast data for push items goes stale between updates. A file last saved 3 weeks ago is already wrong.
- Multiple staff editing the same file create version conflicts. One person's reorder point change overwrites another's without warning.
- There is no audit trail. When an order was placed, who changed a reorder point, and why: none of that is captured.

The Hidden Labor Cost of Manual Inventory Checks
Consider the labor cost alone. 3 staff members each spending 4 hours a week on manual inventory checks, at the median stock clerk wage of around $22 an hour per the US Bureau of Labor Statistics, adds up to roughly $13,728 a year in time spent on a process that a system could handle automatically. That number does not include the cost of the mistakes those checks miss.
Excel is where push and pull inventory goes to become invisible, and invisible systems fail silently.
How Inventory Management Software Supports Both Strategies
Good inventory management software for small distributors handles both push and pull without forcing you to pick one for the entire catalog. Here is what it does:
- Watches live on-hand quantities against each SKU's reorder point and fires a pull alert or a draft buy order automatically
- Stores forecast data at the SKU level and generates suggested buy orders for push items based on projected demand
- Lets you tag each SKU with its strategy, so push items and pull items are managed by different rules in the same system
- Cuts the manual checking and spreadsheet maintenance that consumes staff time each week

What to Look for When Evaluating Inventory Software
When evaluating inventory management software for small distributors, look for these features specifically:
- QuickBooks integration that keeps your accounting system in place
- Reorder point alerts and buy order automating at the SKU level
- Simple enough for a 10 to 50 person operation to adopt without a months-long rollout
- Reporting that shows overstock and stockout risk at a glance, not buried in a data export
What Happened When One Distributor Moved Off Excel
What does switching from a spreadsheet to a push-pull system actually look like in practice? For one mid-size wholesale distributor, the before picture was familiar: push items managed on gut feel, pull items tracked in a shared spreadsheet, and 2 staff members spending roughly half their week on manual stock checks.
The pain showed up as missed reorder triggers on fast movers, excess stock piling up on slow items that someone had forecast too aggressively, and no clear record of who ordered what or when.
Not sure this is the right shape for your operation
Describe how the work runs today. We map it on a call and show you what it would look like built around that, before you spend anything.
Book a call
What Changed After Adding a Lightweight Inventory System
After a lightweight custom inventory software system was added alongside QuickBooks, the distributor tagged each SKU with its strategy. Pull items got reorder points tied to live counts. Push items got a simple forecast template reviewed monthly. Buy order automating handled the routine triggers.
The manual checking dropped sharply, the overstock on slow movers cleared within 2 inventory cycles, and the team had a single place to see which items needed attention. No ERP replacement. No disruption to the accounting workflow.
Common Mistakes and Key Metrics for Push and Pull Inventory
Mistakes to Avoid
Distributors formalizing a push and pull inventory strategy run into the same errors repeatedly:
- Applying one strategy to the entire catalog when different SKUs have very different demand patterns
- Setting reorder points once and never updating them as sales velocity changes
- Using push for items with highly variable demand, which drives up carrying costs
- Using pull for items with long lead times, which creates stockouts that could have been avoided
- Not recording which strategy each SKU is on, so no one can audit or improve the system
Metrics Worth Tracking
Five numbers tell you whether your push and pull rules are working:
- Inventory turnover rate measures how many times stock sells through in a period. A low number on a push item signals overstock.
- Days on hand shows how long current stock will last at the current sales pace. Useful for spotting items about to run out.
- Stockout frequency counts how often an item hits zero before a reorder arrives. High frequency means the reorder point is too low.
- Fill rate tracks the percentage of orders shipped complete and on time. The FTC's Mail and Telephone Order Rule ties your legal shipping obligations directly to having accurate stock counts.
- Carrying cost is the cost of holding unsold inventory, including storage, insurance, and tied-up capital.
Review these metrics monthly. They will tell you which SKUs need their strategy changed before a problem becomes expensive.
How to Audit Your Current Inventory Strategy
You can start this audit in a spreadsheet. The goal is to see clearly what you are already doing and where the gaps are.
- List every SKU and sort by sales velocity, fastest moving at the top
- Mark each item as currently managed by forecast (push) or by reorder trigger (pull)
- Flag items that are chronically overstocked or frequently out of stock
- For overstocked items on a push rule, check whether the forecast is realistic
- For stockout items on a pull rule, check whether the reorder point accounts for lead time and a safety stock buffer
- Use the audit output to assign a clear strategy to each SKU
The US Census Bureau's Monthly Wholesale Trade data tracks the national inventories-to-sales ratio for wholesale firms, which gives you a useful benchmark for whether your overall stock levels are in line with the sector.
An audit does not fix anything by itself, but it shows you exactly where to start.
Getting Started
Push and pull inventory is not a choice between two opposing systems. It is a set of rules you apply SKU by SKU based on lead times, demand patterns, and storage costs. Most small distributors are already doing this informally. The work is making it explicit, tracking it in a system, and reviewing it regularly.
If your current process runs on QuickBooks plus Excel plus email, you do not need to tear it down. You need a lightweight system that connects to what you already have, handles the push and pull logic automatically, and gives your team one clear place to act.
If that sounds like the problem you are trying to solve, The Software Society builds custom workflow systems designed around how your operation already works, without replacing the tools that are already doing their job. Reach out and describe what you are dealing with. We will tell you plainly whether we can help.
Frequently asked questions
What is the difference between push and pull inventory?
Push inventory means you order stock based on a forecast before customers buy. Pull inventory means you order only after a customer buy triggers the need. Push carries overstock risk if the forecast is wrong. Pull carries stockout risk if demand spikes faster than your supplier can respond. Most distributors use both, depending on the SKU.
What is the 80/20 rule in inventory?
The 80/20 rule in inventory says that roughly 80% of your sales come from about 20% of your SKUs. In practice, this means a small group of fast-moving items deserves the most attention in your replenishment process. Identifying that core 20% helps you decide where to apply tighter pull controls and where to rely on push for the slower-moving remainder.
What are four types of inventory?
The four types most distributors work with are raw materials (inputs not yet used), work-in-progress (items being assembled or processed), finished goods (ready to ship), and maintenance, repair, and operations stock (supplies that keep the operation running but are not sold). Wholesale distributors mostly deal in finished goods, though some carry raw materials for light assembly.
What is EOQ and ROP?
EOQ stands for economic order quantity, which is the order size that minimizes the combined cost of ordering and holding stock. ROP stands for reorder point, which is the on-hand quantity at which a new order should be placed. The formula for ROP is: average daily units sold multiplied by lead time in days, plus safety stock. Both EOQ and ROP are tools that support a pull inventory strategy.
Can a small distributor use both push and pull inventory at the same time?
Yes, and most already do. The key is to assign a strategy at the SKU level rather than picking one approach for the entire catalog. Fast movers with short lead times suit pull. Seasonal or import items with long lead times suit push. A simple tag in your inventory system is enough to keep the two sets of rules separate.
Do I need to replace QuickBooks to manage push and pull inventory properly?
No. QuickBooks handles the financial side of inventory well, including valuations required by IRS Publication 538. What it lacks is forecast-driven push replenishment and automated pull triggers. A supplemental inventory system that integrates with QuickBooks can handle those decisions while your accounting workflow stays unchanged.
How often should reorder points be updated?
Review reorder points at minimum every quarter. Update them sooner if a product's sales pattern changes, a supplier's lead time shifts, or you run a promotion that temporarily lifts demand. A reorder point set once and left alone will drift out of alignment and cause stockouts or overstock without any obvious trigger.
Start with a free first look
A 30 minute call, your operation mapped, and a clear picture of what we would build. No obligation and nothing to install.
Book a callRelated guides
The rest of this guide, for the parts of the job this page does not cover.
Guides
- Excess Inventory
- Closed for Inventory
- Multi Location Inventory Management Software
- Inventory Management for Multiple Locations
- Costing Inventory
- Is Inventory a Long-term Asset
- Inventory Management System for Manufacturing
- Inventory Fixed Assets
- Inventory Management Pics
- Excel Inventory Template
- Consumable Inventory
- B2b Inventory Management
- Jewelry Inventory Management
- Dental Inventory Management
- The Objective of Inventory Management is To
- Qr Code for Inventory Management
- Inventory Metrics
- Inventory Formulas
- Hvac Inventory Management Software
- Calculate Beginning Inventory
- Inventory Management Software for Schools
- Find Beginning Inventory