


What Is Abc Classification In Inventory Management
ABC classification in inventory management is one of the most practical tools an operations manager can use. It does not need a complex system or a supply chain degree. It just needs honest data and a willingness to treat your top items differently from your bottom ones.
Reviewed October 2026.
This guide explains how ABC classification works, how to apply it in a real warehouse or distribution operation, and what mistakes to avoid along the way.
Book a callABC Classification in Inventory Management, Explained Simply
ABC classification sorts your inventory into three groups based on value and sales volume. A items are your high-value or fast-moving products. B items sit in the middle. C items are low-value or slow-moving products that make up the bulk of your SKU list but contribute little to revenue.
The goal is straightforward: stop treating every item the same. When you know which products drive most of your revenue, you can direct your time, storage space, and reorder attention toward them. That focus is what makes ABC classification useful in a real operation, not just on paper.
We build it for your operation, and the first look is free
If you would rather not compare products, describe how your operation already works and we build the system around it.
No build cost. You see it running on your own process first, and the monthly subscription starts only once it is live.
Book a callWhere ABC Classification Comes From
ABC classification is rooted in the Pareto principle, also called the 80/20 rule. In most operations, roughly 20 percent of SKUs drive 80 percent of revenue. That imbalance is not a coincidence; it shows up consistently across industries.
As GS1 notes, "barcodes are the foundation of supply chain visibility," and accurate item-level data is what makes any classification system reliable. The 80/20 pattern has held up across decades of distribution and retail data. ABC analysis is simply the practical tool built on top of it.
What Percentage of SKUs Fall Into Each ABC Category?
The typical breakdown gives you a clear starting point, though your actual numbers will vary based on your product mix and customer base.
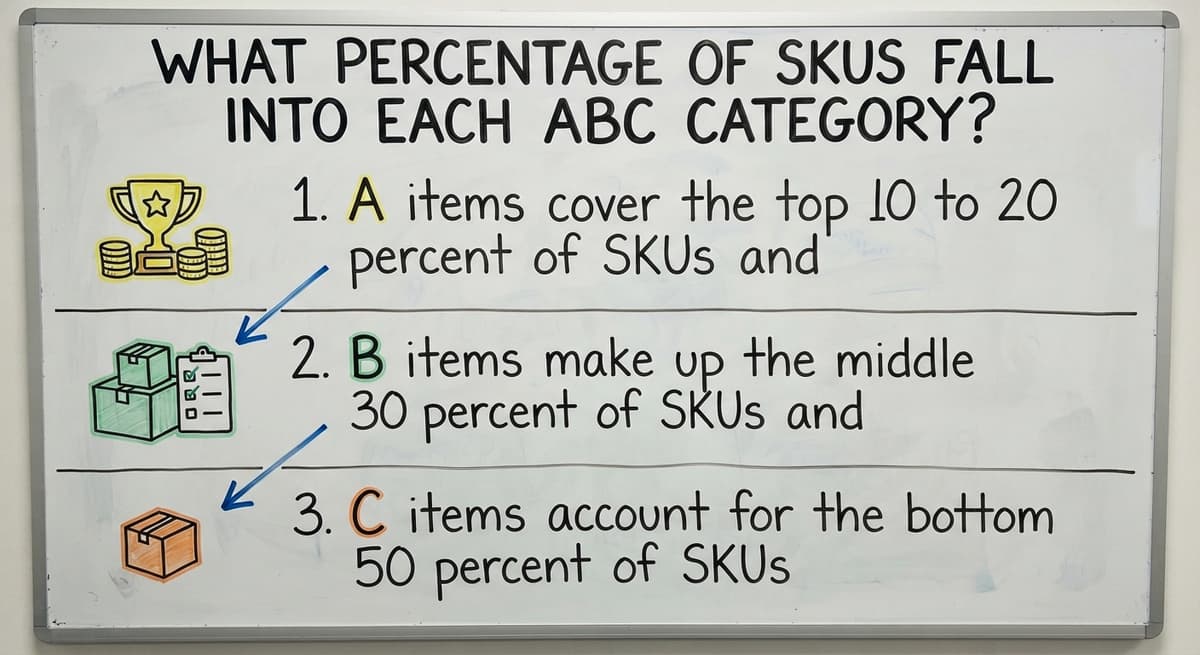
- A items cover the top 10 to 20 percent of SKUs and usually represent 70 to 80 percent of total inventory value or revenue.
- B items make up the middle 30 percent of SKUs and contribute roughly 15 to 20 percent of value.
- C items account for the bottom 50 percent of SKUs but often generate only 5 percent of revenue.
These thresholds are a starting point, not a fixed rule.
What the ABC Breakdown Looks Like in Practice
For a wholesale distributor carrying 2,000 SKUs, roughly 300 to 400 items are doing the heavy lifting. The remaining 1,000-plus SKUs might fill catalog gaps or serve specific customers, but they are not what keeps the lights on. Knowing which bucket each item falls into lets you allocate shelf space, labor, and reorder cycles accordingly.
The comparison is easier when one option is built for you
Off-the-shelf means fitting your process to the software. We do it the other way round, and the first look costs nothing.
Book a call
How to Run an ABC Analysis
Running an ABC analysis does not need specialized software. A spreadsheet handles it well at smaller SKU counts. Here are the steps.
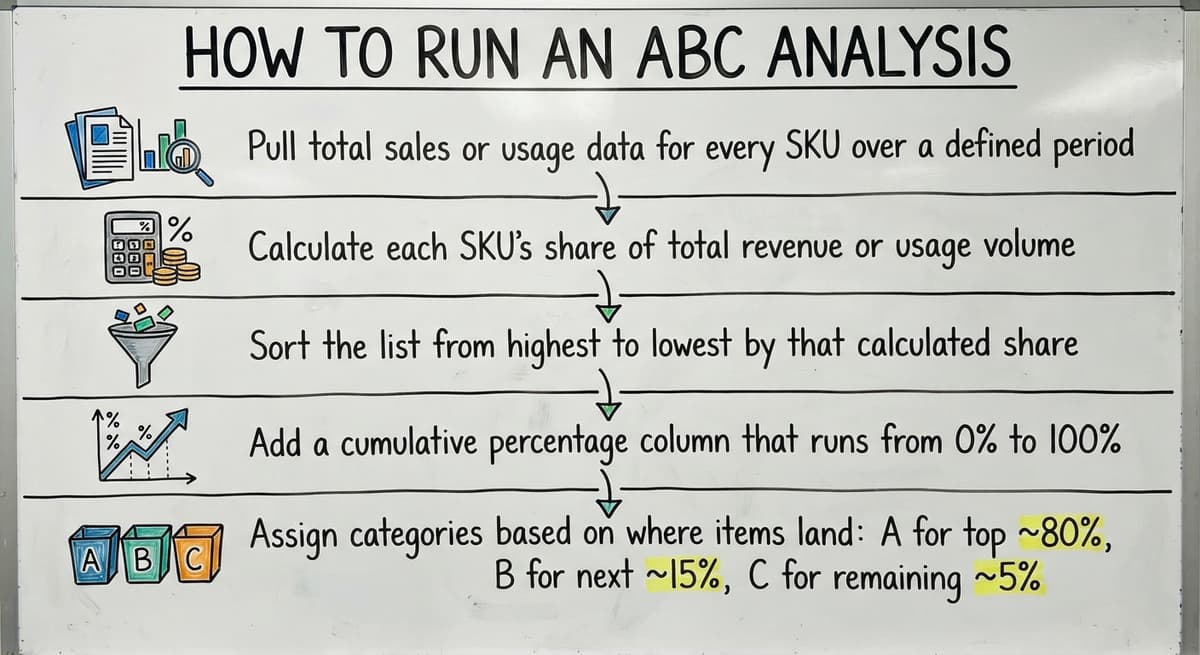
- Pull total sales or usage data for every SKU over a consistent period, usually 12 months.
- Calculate each SKU's share of total revenue or units sold by dividing its sales by the overall total.
- Sort the list from highest to lowest by that percentage so your biggest contributors appear at the top.
- Add a cumulative percentage column that runs from the top of the list downward.
- Assign categories based on where items land: A for the first 70 to 80 percent of cumulative revenue, B for the next 15 to 20 percent, and C for the remainder.
What to Expect From Your Output
The result is a ranked list that tells you exactly where each SKU stands. Most operations managers run this first in a spreadsheet, which works fine until SKU counts climb past a few hundred.

What Each Category Means for Day-to-Day Operations
Inventory classification only pays off when it changes how you actually manage stock. Each category calls for a different operating approach.
A items deserve the tightest controls. Set precise reorder points so you never run short. Schedule more frequent cycle counting, often weekly or bi-weekly, to catch discrepancies before they become fulfillment problems. Position these products in your most accessible pick locations to reduce travel time per order.
B items run on standard replenishment cycles. Review them monthly, adjust safety stock if demand shifts, and count them quarterly. They do not need the same attention as A items, but they should not be ignored either.
How to Manage C Items Without Overspending
C items are where many operations overspend. Bulk ordering reduces per-unit cost and handling frequency. Count them less often, perhaps twice a year. Before cutting any C item entirely, check whether it anchors a customer relationship or completes a product bundle. Working efficiency gains from ABC classification come from applying the right level of effort to each tier, not from treating every item the same.

Common Mistakes When Applying ABC Classification
ABC analysis is straightforward, but a few common errors undercut its value in practice.
- Classifying by revenue alone misses the full picture. A high-revenue item with thin margins and high carrying costs may deserve less priority than its sales rank suggests. Include gross margin and storage cost when the data is available.
- Setting categories once and walking away is the most frequent mistake. Product mix shifts, customer accounts change, and new SKUs enter the catalog. Classifications that are 18 months stale are often wrong.
See it running on your own process first
No build cost. The subscription starts once it is live and doing the job, not before.
Book a callSeasonal Demand and Strategic SKUs
- Ignoring seasonal demand can temporarily push a C item into A territory during a peak period. A summer product classified in January will look very different in July.
- Assuming all C items are dead weight leads to SKU cuts that frustrate key accounts. Some low-volume items are strategically important even if they do not move revenue.
The fix is a regular review cadence, not a one-time project.
ABC Classification and Your Inventory Software
A spreadsheet handles ABC analysis well when you carry fewer than a few hundred SKUs. Beyond that, manual refreshes become a source of error rather than insight.

Inventory management software for wholesale distributors can automate the classification entirely. The system pulls live sales data, recalculates each SKU's cumulative share, and flags items that have crossed a category threshold since the last review. That means your team acts on current data rather than a snapshot from last quarter.
For operations running an accounting package with overflow tracking in spreadsheets, a direct integration for warehouse operations can feed live transaction data into a classification engine without requiring a full platform replacement. The practical benefit is that the manual refresh burden disappears, and category drift gets caught automatically rather than during a quarterly audit. Automating does not change the logic of ABC classification; it just keeps that logic current.
When ABC Classification Works Best
ABC classification delivers the clearest return when your SKU count is large enough that treating every item equally wastes measurable time and money. Wholesale distributors, fulfillment centers, and warehouses with mixed product lines are the natural fit.
Operations with a very small, uniform catalog, say 50 SKUs with similar margins and velocity, gain little from the exercise. Every item already gets individual attention by default.
For everyone else, even a rough A-B-C split gives operations managers a sharper picture of where to direct cycle counting, storage investment, and buyer attention. Replacing Excel-based inventory tracking with a system that automates this split removes the single biggest barrier to keeping classifications useful over time.

What Should You Take Away From ABC Classification?
ABC classification divides your inventory into three tiers: high-impact A items that need tight controls, mid-range B items on standard cycles, and low-priority C items managed in bulk. The method is only useful if you treat it as an ongoing discipline rather than a one-time sort.
Software that automates the classification keeps your categories accurate as your product mix evolves. If your current setup makes it hard to stay current, that is a process problem worth solving. Custom inventory software for small distributors can bridge the gap between a spreadsheet and a full enterprise system, giving you live classifications without overhauling everything at once.
Frequently asked questions
What is an example of ABC analysis?
A wholesale distributor carrying 1,000 SKUs runs 12 months of sales data and sorts every item by revenue contribution. The top 150 SKUs account for 75 percent of total revenue; those become A items. The next 300 SKUs cover another 18 percent and become B items. The remaining 550 SKUs generate only 7 percent of revenue and are classified as C items. The distributor then sets tighter reorder points and weekly cycle counts for A items, monthly reviews for B items, and quarterly bulk orders for C items.
How to classify inventory?
Start by pulling sales or usage data for every SKU over a set period, usually 12 months. Calculate each item's share of total revenue, then sort the list from highest to lowest. Add a running cumulative percentage. Items that land in the first 70 to 80 percent of cumulative revenue become A items, the next 15 to 20 percent become B items, and the rest are C items. Adjust the thresholds to fit your actual product mix, and plan to repeat the process at least twice a year.
What is the ABC system of material control?
The ABC system of material control is an inventory management approach that groups materials or SKUs into three categories based on their value and consumption rate. A items receive the closest monitoring, tightest reorder controls, and most frequent physical counts because they represent the largest share of cost or revenue. B items get standard controls. C items are managed with less frequency and often ordered in bulk. The system lets operations teams concentrate limited resources on the materials that matter most.
What is the formula for ABC analysis?
There is no single formula, but the core calculation is straightforward. For each SKU, divide its annual sales value by the total annual sales value of all SKUs to get its percentage share. Sort all SKUs from highest to lowest by that percentage. Then calculate a running cumulative percentage down the sorted list. Assign A to items within the first 70 to 80 percent of cumulative value, B to the next 15 to 20 percent, and C to everything remaining. Adjust the cutoff points based on your operation's actual distribution.
How often should you update your ABC classifications?
Most operations benefit from a full reclassification at least twice a year, with a lighter review quarterly. Product mix changes, new customer accounts, and seasonal demand shifts can move items between categories faster than an annual review catches. Operations using inventory software that recalculates classifications automatically are less exposed to stale data.
Can ABC classification work for a small or mid-sized distributor?
Yes. ABC classification is especially useful for small and mid-sized distributors because they usually have limited staff and cannot afford to apply equal attention to every SKU. Even a basic spreadsheet-based analysis on 200 to 500 SKUs will surface which items deserve tighter reorder controls and which can be managed on a lighter schedule. The method scales up as SKU counts grow.
How does ABC classification help warehouses and distributors manage stock?
By separating high-impact items from low-impact ones, ABC classification lets warehouse teams direct cycle counting labor, prime pick locations, and reorder attention toward the SKUs that drive most of their revenue. That focus reduces stockouts on critical items, cuts unnecessary handling of slow movers, and gives operations managers a clearer basis for storage layout and staffing decisions.
What mistakes should operations managers avoid when using ABC classification?
The most common mistakes are classifying by revenue alone without factoring in margin or carrying cost, setting categories once and never refreshing them, ignoring seasonal shifts that temporarily change an item's velocity, and cutting C items without checking whether they serve a strategic customer. A regular review schedule and a willingness to adjust thresholds over time prevent most of these problems.
Start with a free first look
A 30 minute call, your operation mapped, and a clear picture of what we would build. No obligation and nothing to install.
Book a callRelated guides
The rest of this guide, for the parts of the job this page does not cover.
Guides
- Classification of Inventory
- Multi Location Inventory Management Software
- Inventory Management for Multiple Locations
- Inventory Management System for Manufacturing
- Inventory Management Pics
- B2b Inventory Management
- Jewelry Inventory Management
Common questions
- What is the Difference Between Aggregate and Item Inventory Management
- What is Inventory Management and Its Types
- What is the Main Purpose of Inventory Management
- What is Information Technology Inventory Management
- What is Risk Pooling in Inventory Management
- What is Stock Taking in Inventory Management
- What is Bin Number in Inventory Management
- What is Inventory Management and Why is It Important
- What is the Management and Non Managerial Human Resources Inventory
- What is Inventory Listing
- What is Inventory
- What is the Best Warehouse Inventory Management System?
- What is the Difference Between Warehousing and Inventory Management
- What is B Type of Inventory in Warehouse Management
- What is Warehousing and Inventory Management
- What is the Best Inventory Management Software for Small Business
- What is the Best Inventory Management System for Small Businesses?