


What Is The Difference Between Aggregate And Item Inventory Management
Reviewed and updated: October 2026
Book a callThe Short Answer
Aggregate inventory management looks at your total stock as one combined number. Item inventory management tracks each individual product or SKU separately. Both approaches answer different questions. Aggregate tells you how much capital is tied up in stock. Item-level tracking tells you whether a specific product is about to run out. Most operations need both, and the trouble starts when they run them in separate systems.
We build it for your operation, and the first look is free
If you would rather not compare products, describe how your operation already works and we build the system around it.
No build cost. You see it running on your own process first, and the monthly subscription starts only once it is live.
Book a callWhat Is Aggregate Inventory Management?
Aggregate inventory management means looking at your entire stock as a single pool. You measure total value, average days of supply, or overall turnover rate rather than watching each product on its own.
Owners and finance teams use aggregate metrics to set budgets, track how much cash is tied up in stock, and spot trends over time. A wholesale distributor checking whether total stock value climbed or fell month over month is doing aggregate inventory management.
Why Aggregate Inventory Tracking Is Already a Legal Requirement
The IRS makes aggregate valuation a legal requirement. IRS Publication 538 states: "To figure taxable income, you must value your inventory at the beginning and end of each tax year." That is not optional, which means every business already has some form of aggregate tracking, whether they call it that or not.
Accurate aggregate numbers also depend on reliable item counts underneath them. GS1 notes that barcode standards exist specifically to make scan-based counts consistent, which is what makes the rolled-up total trustworthy.
The aggregate view tells you whether your overall stock investment is healthy, but it cannot tell you which shelf is empty.
What Does Item Inventory Management Mean?
Item inventory management means tracking stock at the level of each individual product, SKU (stock keeping unit, a unique code for one product), or unit. Instead of one total, you see counts per product, reorder points per SKU, and lead times per supplier.
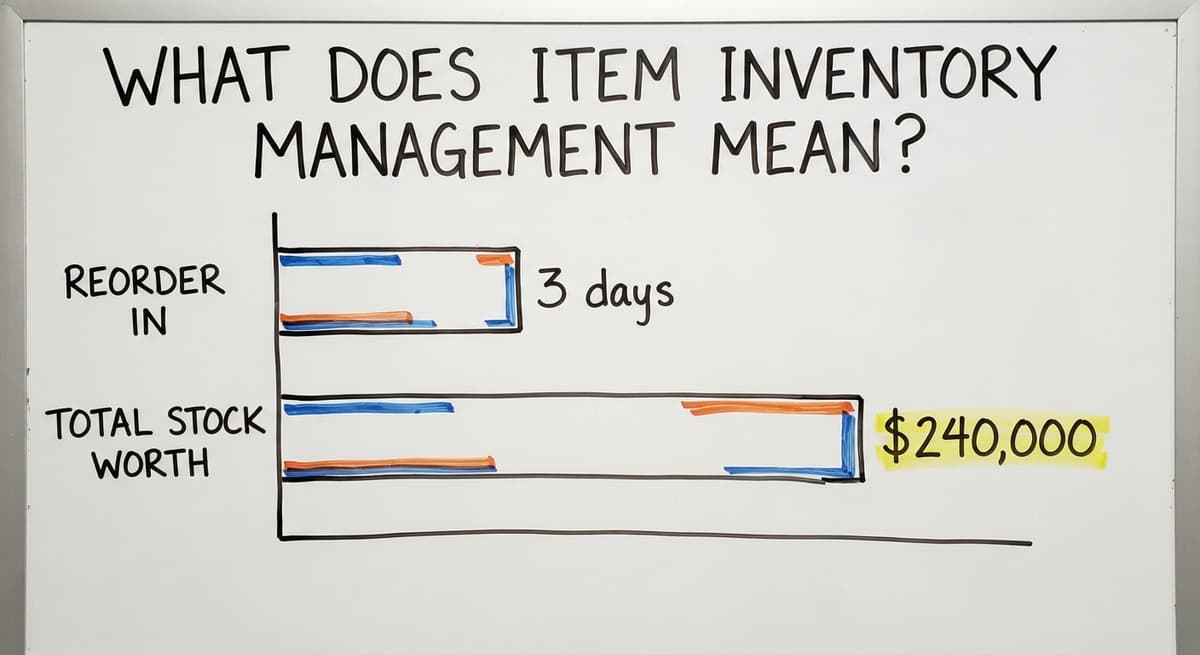
Warehouse staff and operations managers rely on this detail every day. Knowing that SKU 1042 has 14 units left and needs a reorder in 3 days is item-level inventory management. Knowing that total stock is worth $240,000 is not.

Key Metrics Item Inventory Management Tracks
Common item-level metrics include:
- Units on hand per SKU, so staff know what is physically on the shelf
- Reorder point per product, the count that triggers a buy order before stock runs out
- Lead time per item, how many days a supplier needs to replenish it
- Velocity, how fast a product sells so you can size your safety stock correctly
Aggregate tracking shows you the forest. Item tracking shows you each tree. A business that only watches the forest will be surprised when a specific tree falls.
Item inventory management is what keeps daily operations running without stock-outs or over-ordering on individual products.
The comparison is easier when one option is built for you
Off-the-shelf means fitting your process to the software. We do it the other way round, and the first look costs nothing.
Book a callHow the Two Approaches Work Together
Aggregate and item management are not competing methods. They answer different questions at different levels of the business.
Aggregate answers: Are we holding too much or too little inventory overall? Is our turnover rate healthy? Are we tying up more cash in stock than last quarter?
Item management answers: Do we have enough of this product right now? When do we need to reorder it? Which SKUs are moving and which are sitting?
Healthy warehouse inventory control uses both. Owners and finance teams watch aggregate totals for strategy. Operations managers and warehouse staff use item-level data for daily decisions.
What Happens When You Run Only One Without the Other
Running only one method without the other creates blind spots. A business with strong aggregate tracking but no SKU-level detail will see a healthy total value while a key product sits at zero units. A business with tight item tracking but no aggregate view has no way to know whether total stock investment is growing out of control.

The two methods are most useful when they feed from the same source, so the item counts roll up automatically into the totals the owner watches.
Why Stock-Outs Happen Even When Totals Look Fine
Stock-outs hitting wholesale distributors even when aggregate numbers look healthy are one of the most common pain points in the industry. The aggregate number looks healthy. The bank account is not flashing red. But a specific SKU is empty and a customer order cannot ship.
The US Federal Trade Commission needs businesses to ship orders within the time they promised, or notify customers and offer a refund. An accurate item-level count is what keeps you on the right side of that rule.
The fix is not to watch aggregate totals more closely. It is to add item-level visibility so the reorder point on each SKU triggers action before the shelf goes empty.
Where Distributors and Warehouses Run Into Trouble
Many small distributors track aggregate totals in an accounting package and manage item-level detail in spreadsheets or printed pick sheets. The two systems do not talk to each other.
The aggregate number in the accounting package looks fine. But a specific SKU is stocked out because no one updated the spreadsheet after last week's rush order. The pick sheet still shows 20 units. The shelf has none.
What Split Inventory Systems Cost in Staff Time
Manual handoffs between an accounting package, a spreadsheet, and email slow down every reorder decision. By the time someone notices the discrepancy, the customer order is already late.

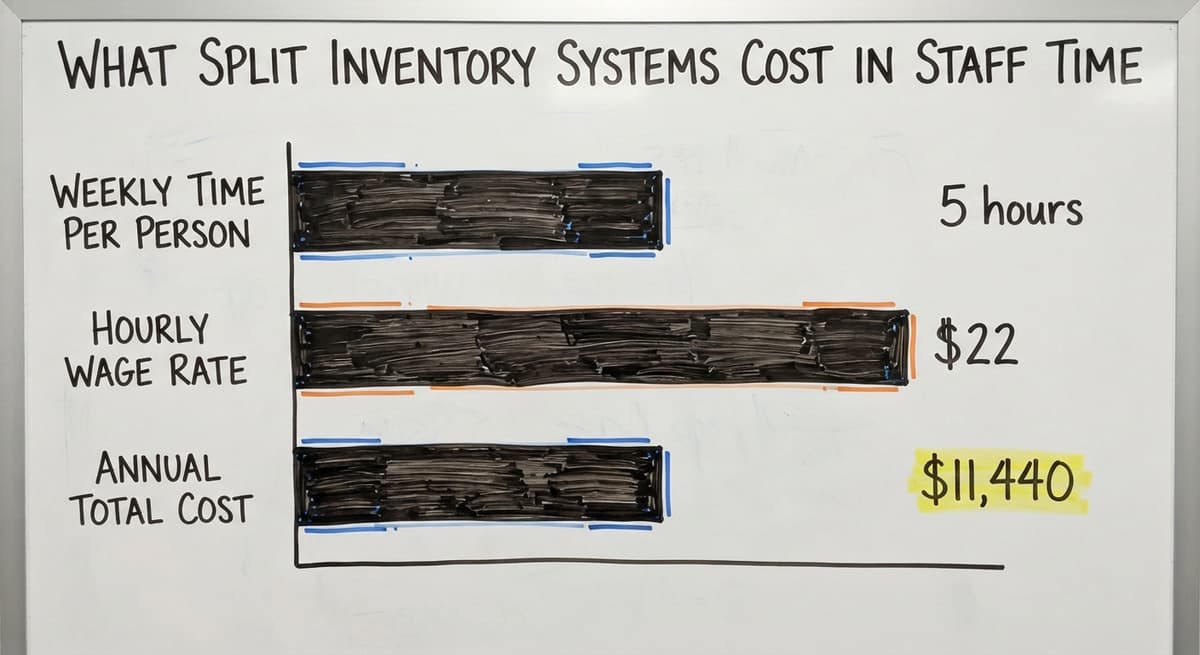
Consider what this costs in staff time alone. If 2 people spend 5 hours each week reconciling counts between systems at a wage of $22 an hour (near the median for stock clerks and order fillers, per the US Bureau of Labor Statistics), that is $11,440 a year spent on a problem that better-connected systems would remove.
The real cost of split systems is not just the time. It is the decisions that get made on stale data.
The Spreadsheet Trap
Spreadsheets feel flexible, but they break down as SKU counts grow. A file that works at 50 products becomes unreliable at 500. Version conflicts, manual entry errors, and forgotten saves turn a spreadsheet into a liability rather than a tool.
Replacing spreadsheets with inventory tracking software does not mean replacing everything at once. It means connecting the item-level detail to the aggregate totals so both views are accurate at the same time.
See it running on your own process first
No build cost. The subscription starts once it is live and doing the job, not before.
Book a callWhich Method Should You Focus On?
The answer depends on your role, not a general rule.
If you are an owner watching cash flow and total stock investment, aggregate metrics are what you need to see first. Total inventory value, turnover rate, and days of supply tell you whether the business is holding the right amount of stock overall.
If you are an operations manager running a warehouse floor, item-level detail drives every decision you make. Reorder points, units on hand, and lead times are what keep orders shipping on time.

How Inventory Software Surfaces the Right View to the Right Person
Most businesses with 5 to 100 staff need both views, but the right inventory software surfaces each one to the right person automatically. The owner sees totals. The warehouse manager sees SKU counts. Neither has to pull data from the other's system to do their job.
The goal is not to pick one method. It is to make sure the right data reaches the right person without manual work in between.
How Inventory Software Supports Both Approaches
Good inventory software connects item-level transactions to aggregate totals without a manual roll-up step. Every time a unit moves, the item count updates. The aggregate total updates with it. Both views stay current.
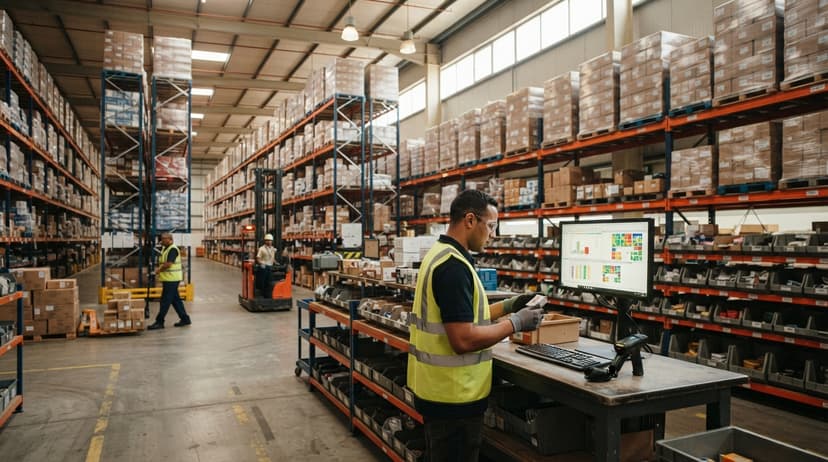
An accounting package handles financial totals well. Purpose-built inventory management software for wholesale distributors handles item tracking, reorder logic, and warehouse inventory control at the SKU level. The two can work together when they share data.
How Custom Inventory Software Fits an Existing Operation
Custom software built around an existing operation can feed the accounting package the numbers it needs without replacing it. How custom software connects with your accounting package is a question many distributors ask, and the answer is usually that the inventory layer handles the detail while the accounting package handles the books.
The NIST Manufacturing Extension Partnership recommends aligning software to real working workflows rather than forcing operations to fit a generic system. That principle applies directly here: the goal is to replace the manual matching steps, not to overhaul a business that is otherwise running well.
Inventory software earns its place when it removes the manual work between item counts and aggregate totals, not when it adds a new system to manage.
What to Look for in an Inventory System
When evaluating options, focus on these capabilities:
- Item-level tracking that updates in real time as stock moves, so counts are never a day behind
- Automatic reorder point alerts that trigger buy orders before a SKU runs out
- Aggregate reporting that rolls up from item counts, not from a separate manual entry
- Integration with your existing accounting package so financial totals stay accurate without double entry
- Warehouse management software for small operations that fits your team size rather than assuming enterprise-scale staff
Not sure this is the right shape for your operation
Describe how the work runs today. We map it on a call and show you what it would look like built around that, before you spend anything.
Book a callSigns Your Current Setup Is Not Giving You Both Views
Use this list as a quick check on your own operation. Each item points to a gap between aggregate and item-level visibility.
- You know your total inventory value but regularly run out of specific items. This is the clearest sign that aggregate and item-level data are not connected.
- You track individual SKUs carefully but have no fast way to see total stock investment without pulling a manual report.
- Reorder decisions depend on someone remembering to check a spreadsheet, not on an automatic alert.
- Reports take hours to build because data lives in 3 or more places.
- Your warehouse staff and your finance team are looking at different numbers for the same stock.
- A supplier lead time changes and no one updates the reorder point because the two pieces of data live in separate files.
What National Wholesale Data Reveals About Poor Item Visibility
The US Census Bureau Monthly Wholesale Trade data tracks the inventories-to-sales ratio for wholesale firms nationally. When that ratio climbs, it usually means firms are holding more stock than they are moving. Poor item-level visibility is a common driver: businesses over-order on some SKUs because they cannot see what is already on the shelf.
If more than 2 of these signs match your operation, the gap between your aggregate and item views is already costing you money.
What Are the Next Steps for Wholesale Distributors and Warehouse Operators?
Start by deciding which view your team is currently missing. Most operations have one but not the other, and that tells you where to focus first.
Map where your data currently lives. Accounting package, spreadsheets, an Access database, paper pick sheets: list every place a count or a value is stored. That map shows you exactly where the manual handoffs happen.
Why Custom Workflow Implementation Often Beats a Generic Platform
Look for a solution that connects both views without forcing a full system replacement. Inventory management software for wholesale distributors built around your existing workflow can close the gap between item counts and aggregate totals without a long, expensive rollout.
Custom workflow rollout, built around how your operation already runs, is often faster and less disruptive than adopting a generic platform that needs you to change your process to fit the software.
If you want to talk through what that looks like for your specific setup, reach out. The conversation starts with your workflow, not a product demo.
Frequently asked questions
What is the definition of aggregate inventory?
Aggregate inventory is the total value or quantity of all stock a business holds, viewed as a single combined number rather than broken down by individual product. It is used to measure overall capital tied up in stock, track inventory turnover rate, and set purchasing budgets. The IRS needs businesses to value total inventory at the start and end of each tax year, which is an aggregate measure by definition.
What is EOQ and ROP?
EOQ stands for Economic Order Quantity, the ideal order size that balances the cost of ordering too often against the cost of holding too much stock. ROP stands for Reorder Point, the unit count at which a buy order should be placed so stock arrives before the shelf runs out. Both are item-level tools. You calculate them per SKU, not for your inventory as a whole. Together they are the core logic behind automated reorder alerts in any inventory tracking system.
What is the 80/20 rule in inventory?
The 80/20 rule in inventory, sometimes called ABC analysis, holds that roughly 20% of your SKUs generate about 80% of your sales or revenue. In practice, this means a small number of products carry most of the business. Knowing which items fall into that top group lets you set tighter reorder points and safety stock levels for the SKUs that matter most, and looser controls on slow movers. This analysis only works at the item level, not the aggregate level.
What does inventory management consist of?
Inventory management covers every step from receiving stock to shipping it out. That includes recording what arrives and where it is stored, tracking units on hand per SKU, setting reorder points so stock is replenished before it runs out, valuing total stock for financial reporting, and reconciling physical counts against system records. Both aggregate and item-level tracking are part of this. The aggregate view supports financial and strategic decisions. The item-level view supports daily warehouse operations.
Can a business use both aggregate and item inventory management at the same time?
Yes, and most operations should. The two methods answer different questions. Aggregate tracking tells owners and finance teams whether overall stock investment is healthy. Item-level tracking tells warehouse staff whether a specific product needs to be reordered today. When both views come from the same system, the item counts roll up into the aggregate totals automatically. The problem most small distributors face is that the two views live in separate tools, which creates gaps and errors.
Why do distributors run out of stock even when total inventory value looks healthy?
This happens when aggregate and item-level data are not connected. The total inventory value can look fine while one or more specific SKUs sit at zero units. If the aggregate number is pulled from an accounting package and the item counts live in a spreadsheet that was not updated after a recent order, the two numbers tell different stories. The solution is item-level tracking that updates in real time and feeds the aggregate total automatically, so both views reflect the same reality.
How does inventory software connect item-level tracking to aggregate totals?
Good inventory software records every stock movement at the SKU level and rolls those counts up into aggregate totals automatically. When a unit ships, the item count drops by one and the total inventory value updates with it. No manual entry is needed to keep both views current. For businesses that use an accounting package for financial reporting, the inventory software can pass updated totals to it directly, so the books and the warehouse counts stay in sync without a separate matching step.
Start with a free first look
A 30 minute call, your operation mapped, and a clear picture of what we would build. No obligation and nothing to install.
Book a callRelated guides
The rest of this guide, for the parts of the job this page does not cover.
Guides
- Multi Location Inventory Management Software
- Inventory Management for Multiple Locations
- Inventory Management System for Manufacturing
- Inventory Management Pics
- B2b Inventory Management
- Jewelry Inventory Management
- Dental Inventory Management
Common questions
- What is the Difference Between Warehousing and Inventory Management
- What is Inventory Management and Its Types
- What is the Main Purpose of Inventory Management
- What is Information Technology Inventory Management
- What is Risk Pooling in Inventory Management
- What is Stock Taking in Inventory Management
- What is Bin Number in Inventory Management
- What is Inventory Management and Why is It Important
- What is the Management and Non Managerial Human Resources Inventory
- How to Manage Inventory Between Etsy and Shopify
- What is Inventory Listing
- What is Inventory
- What is the Best Warehouse Inventory Management System?
- What is B Type of Inventory in Warehouse Management
- What is Warehousing and Inventory Management
- What is the Best Inventory Management Software for Small Business
- What is the Best Inventory Management System for Small Businesses?