

What Is Risk Pooling In Inventory Management
Risk pooling in inventory management means combining demand from multiple locations, products, or customers into one shared pool so that high demand in one area offsets low demand in another. The result: less total safety stock, fewer stockouts, and less overstock. Any wholesale distributor can apply it, regardless of size.
The obligation behind all of this is not optional. IRS Publication 538 states: “To figure taxable income, you must value your inventory at the beginning and end of each tax year.” A figure nobody trusts makes that number a guess.
Reviewed and updated: October 2026
Book a callRisk Pooling in Inventory Management, Explained in Plain Terms
Imagine you run 2 stores. One sells out of a product on Tuesday. The other has 30 units sitting on the shelf. If those stores share a single stockpile, the surplus covers the shortage automatically. That is risk pooling.
It is not a software feature. It is a way of deciding where you hold stock and why. The core idea is that demand swings are more predictable when you look at them together than when you look at each location alone. A spike here and a dip there cancel each other out across a combined pool.
Small and mid-size distributors can use this thinking today, even with basic tools.
We build it for your operation, and the first look is free
If you would rather not compare products, describe how your operation already works and we build the system around it.
No build cost. You see it running on your own process first, and the monthly subscription starts only once it is live.
Book a callWhy Demand Variability Is the Real Problem
Customers never order the same amount each week. Some weeks are busy. Some are slow. That unpredictability is called demand variability, and it is the root cause of both stockouts and overstock.
Safety stock exists to cover those swings. But the wider the swing, the more buffer a business feels it must hold. Holding too much safety stock ties up cash that could be used elsewhere.
GS1, the global standards body behind barcode and supply chain standards, notes that accurate, scan-based data is the foundation of any reliable count, as explained at GS1's barcode standards page. Without reliable demand data, setting the right buffer is guesswork. Risk pooling shrinks the swing itself, which shrinks the buffer you need.
How Does Risk Pooling Work?
Risk pooling works by combining demand streams so that variance across the whole group is lower than the sum of each stream's variance on its own.

Here is a simple example. Warehouse A sells between 80 and 120 units a week. Warehouse B also sells between 80 and 120. Each one needs a buffer to cover the high end. But when you look at both together, total demand runs between 180 and 210 units most weeks because a high week at A often pairs with a slow week at B. The combined swing is smaller than either swing alone.
That smaller swing means you need less total safety stock to hit the same service level. You are not taking more risk. You are spreading it across a larger, more stable base. This is the statistical engine behind every form of inventory pooling.
The comparison is easier when one option is built for you
Off-the-shelf means fitting your process to the software. We do it the other way round, and the first look costs nothing.
Book a call
Three Common Forms of Risk Pooling
Risk pooling shows up in 3 practical forms. Each one targets a different source of variability.
Location pooling means holding stock in fewer places, often a single distribution center, rather than spreading thin quantities across many sites. A centralized inventory pool absorbs local demand swings without requiring each site to carry its own buffer.
Product pooling means stocking a common base component or unfinished SKU that can be configured when an order arrives, rather than pre-building every finished variant. This delays the point at which inventory becomes specific, which keeps options open longer.
Lead-time pooling means shortening or stabilizing replenishment cycles so the window of uncertainty shrinks. A reliable 2-day restock needs far less buffer than an unpredictable 14-day one.
Each form reduces the buffer required, and a distributor can apply more than one at the same time.

The Trade-Off: Centralization vs. Speed
Centralizing inventory cuts the total stock a business must carry. The catch is distance. A single warehouse that serves a wide region may be farther from some customers, which can mean slower delivery or higher freight costs.
For a wholesale distributor serving a tight regional area, 1 well-run facility often outperforms 3 small stockrooms. The carrying cost savings on reduced safety stock can more than offset the modest increase in outbound freight.
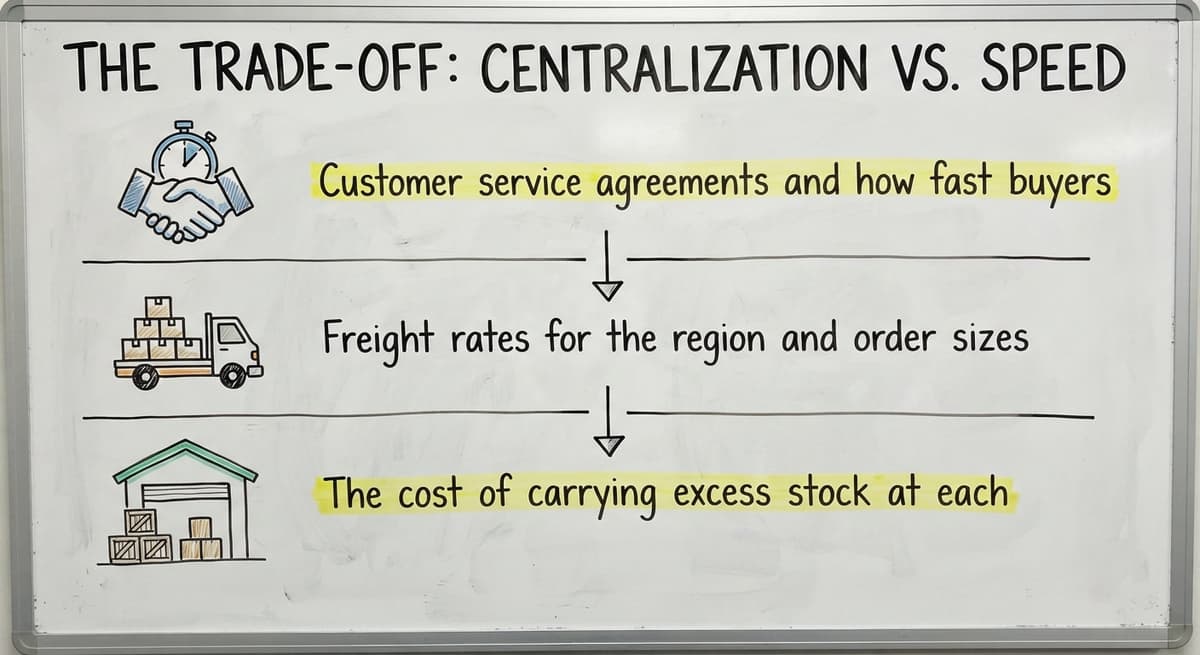
The right balance depends on 3 factors:
- Customer service agreements and how fast buyers expect delivery
- Freight rates for the region and order sizes involved
- The cost of carrying excess stock at each satellite location
Neither full centralization nor full decentralization is always correct. The goal is to find the point where fulfillment speed and inventory cost reach their best combined result for your specific customer base.
Risk Pooling for Small Wholesale and Distribution Operations
Most textbooks teach risk pooling through the lens of large enterprises with dozens of distribution centers. It applies just as well to an operation with 5 to 50 staff.

A small wholesale distributor running multiple product lines can pool demand data across those lines before setting reorder points. A distributor serving several customer segments can look at combined weekly demand rather than tracking each segment in isolation.
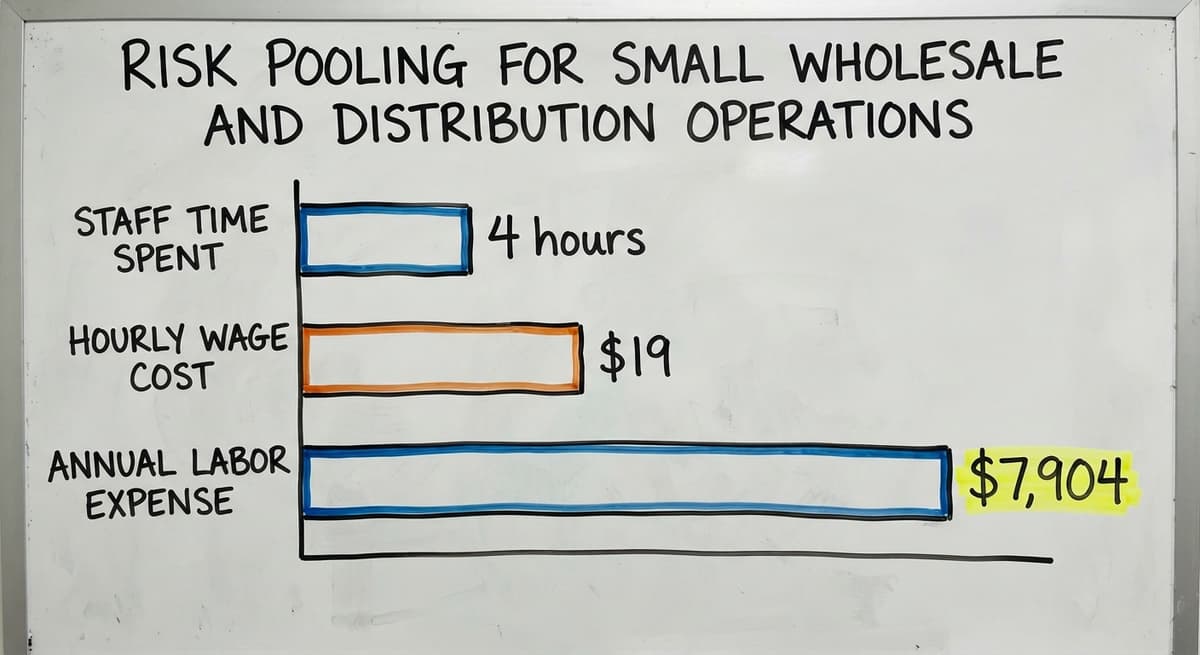
Consider a distributor with 2 staff each spending 4 hours a week manually reconciling location-by-location stock levels. At the current median wage for stock clerks of around $19 per hour, per the US Bureau of Labor Statistics, that is roughly $7,904 a year spent on a process that pooled data would largely remove.
You do not need a full ERP to start. A business tracking inventory in a spreadsheet or an accounting package can apply pooled thinking simply by reviewing combined demand totals before placing orders. Better tools make it easier to sustain, but the concept costs nothing to adopt.
How Software Makes Risk Pooling Practical
Spreadsheets show one location or one SKU at a time. Seeing combined demand patterns across locations or product groups in real time needs pulling data together manually, and that step is where the insight usually gets lost.
Inventory management software for wholesale distributors that connects to an accounting package surfaces aggregated demand data without forcing a business to replace its existing financial system. Reorder points calculated from pooled demand history replace the guesswork that leads to both overstock and stockouts.
Custom-built operations software can be shaped around how a specific distributor already groups its products and customers. That means the pooling logic matches real buying patterns rather than a generic template. Automated alerts flag when combined demand is trending above or below the expected range, giving a buyer time to act before a stockout hits.
The NIST Manufacturing Extension Partnership offers vendor-neutral guidance on building supply chain processes that scale, and consistently points to data visibility as the prerequisite for any demand-driven strategy. Software is what makes that visibility routine rather than a weekend project.
See it running on your own process first
No build cost. The subscription starts once it is live and doing the job, not before.
Book a callSigns Your Operation Could Benefit from Risk Pooling
Some patterns in a distribution operation point clearly toward a pooling problem. If several of these sound familiar, the concept is worth acting on now.
- Large safety stock at multiple sites, yet stockouts still happen at individual locations because each site is buffering independently.
- Certain SKUs are chronically overstocked while others run dry, a classic signal of unbalanced demand across a fragmented view.
- Reorder points are set location by location in separate spreadsheets with no consolidated picture of total demand.
- Staff spend time manually moving stock between sites to cover shortfalls rather than relying on a planned replenishment process.
Any one of these is a sign that demand aggregation could reduce both the stock you carry and the firefighting your team does each week.
How Do You Get Started with Risk Pooling?
Start by pulling at least 3 months of demand history and comparing combined totals to individual location totals. If the combined variance is lower, pooling will cut your required safety stock.
Here is a practical sequence:
- Map every location where you hold inventory and identify which sites serve overlapping customer demand.
- Pull demand data by SKU for each location and calculate the weekly range at each site versus the combined weekly range.
- Pick 1 or 2 SKU categories where variance drops clearly when totals are combined, and pilot a pooled reorder strategy there first.
- Review whether your current tools give you that combined view automatically, or whether you are building it by hand each time.
- If manual work is the bottleneck, explore a connected inventory system. Replacing Excel-based inventory tracking with custom software removes the step that makes pooling hard to sustain.
The US Census Bureau's Monthly Wholesale Trade data shows that inventories-to-sales ratios shift meaningfully across wholesale sectors, which means the right buffer level is not static. A pooled view updated regularly keeps your reorder points aligned with actual demand rather than last year's assumptions.
Safety stock calculation for small distributors becomes far more accurate once demand is pooled. The math does not change; the input data just gets more stable, and a stable input produces a buffer you can trust.
Putting It Together
Risk pooling is not a theory for big companies. It is a practical way to hold less stock, serve customers reliably, and stop moving inventory around by hand to cover gaps your process created.
Start with your data. Look at combined demand. Find the SKUs where variance drops when you pool. Set 1 reorder point based on that combined picture and watch what happens to your buffer and your stockout rate.
If your current tools make that visibility hard to get, a connected inventory system built around how you already work is the logical next step. An accounting integration for warehouse and distribution operations keeps your books intact while giving your operations team the aggregated demand view that makes pooling work in practice.
The businesses that reduce overstock and stockouts at the same time are not holding more inventory. They are holding smarter inventory, and risk pooling is how they do it.
Frequently asked questions
What is an example of risk pooling?
A wholesale distributor with 2 regional warehouses holds 60 units of safety stock at each site to cover demand swings, for a total of 120 units. After analyzing combined demand, the team finds that a high week at one warehouse almost always pairs with a slow week at the other. By shifting to a single centralized pool, the same service level needs only 75 units of safety stock total, freeing 45 units of tied-up cash.
What does inventory pooling mean?
Inventory pooling means treating stock held across multiple locations, product lines, or customer groups as a single shared resource rather than separate buckets. When one location runs short, the pool covers it. When another has surplus, the pool absorbs it. The result is less total stock needed to hit the same fill rate.
What does "risk pooling" mean?
Risk pooling means combining uncertain demand from multiple sources so that the highs and lows offset each other. The combined demand stream is more predictable than any single stream alone. That predictability lets a business carry less safety stock without increasing the chance of a stockout.
What is the 80/20 rule in inventory?
The 80/20 rule in inventory, often called Pareto analysis, holds that roughly 80% of a business's revenue usually comes from about 20% of its SKUs. Distributors use this to rank which products get tighter reorder controls and which can tolerate a simpler replenishment approach. It is a separate concept from risk pooling, but the two work well together: apply pooled demand logic most carefully to the top 20% of SKUs where stockouts cost the most.
Does risk pooling only apply to large companies with many warehouses?
No. Any business managing demand across more than one location, product line, or customer segment can apply risk pooling. A distributor with 2 warehouses or 3 product categories benefits from the same logic as a company with 30 distribution centers. The math scales down, but the principle does not change.
How does pooling demand reduce the safety stock a business needs?
When demand is viewed in aggregate, the swings at individual locations partially cancel each other out. The combined variance is lower than the sum of each location's variance. A lower variance means a smaller buffer is needed to cover the worst-case week, so the business can cut total safety stock while maintaining the same service level.
What are the different types of risk pooling?
The 3 main types are location pooling (holding stock in fewer, larger facilities), product pooling (stocking a common base component rather than every finished variant), and lead-time pooling (shortening replenishment cycles to reduce the window of uncertainty). Many distributors apply more than one type at the same time.
Start with a free first look
A 30 minute call, your operation mapped, and a clear picture of what we would build. No obligation and nothing to install.
Book a callRelated guides
The rest of this guide, for the parts of the job this page does not cover.
Guides
- Multi Location Inventory Management Software
- Inventory Management for Multiple Locations
- Inventory Management System for Manufacturing
- Inventory Management Pics
- B2b Inventory Management
- Jewelry Inventory Management
- Dental Inventory Management
- The Objective of Inventory Management is To
- Qr Code for Inventory Management
- Hvac Inventory Management Software
- Inventory Management Software for Schools
Common questions
- What is Inventory Management and Its Types
- What is the Main Purpose of Inventory Management
- What is Information Technology Inventory Management
- What is Stock Taking in Inventory Management
- What is Bin Number in Inventory Management
- What is Inventory Listing
- What is Inventory
- What is the Best Warehouse Inventory Management System?
- What is the Difference Between Warehousing and Inventory Management
- What is B Type of Inventory in Warehouse Management
- What is Warehousing and Inventory Management
- What is the Best Inventory Management Software for Small Business
- What is the Best Inventory Management System for Small Businesses?