


Cogs Average Inventory
COGS average inventory connects 2 numbers every distributor already tracks: cost of goods sold and the value of stock on hand. Together they tell you how fast your inventory turns into revenue. Divide cost of goods sold by average inventory and you get the inventory turnover ratio. That single ratio reveals whether your cash is working or sitting idle on a shelf.
Reviewed and updated: October 2026
Book a callWhat COGS Average Inventory Means for Your Operation
Cost of goods sold, or COGS, is what you paid for the products you sold during a period. It does not include rent or salaries. It is the direct cost of the goods that left your warehouse.
Average inventory is the midpoint between what you had at the start of a period and what you had at the end. Add those 2 values and divide by 2. That midpoint smooths out the noise caused by a big buy order arriving on the last day of the month.
Used together, these figures tell you how quickly your stock is moving. A warehouse manager can act on that. An accountant files it.
We build it for your operation, and the first look is free
If you would rather not compare products, describe how your operation already works and we build the system around it.
No build cost. You see it running on your own process first, and the monthly subscription starts only once it is live.
Book a callThe Formula and How to Apply It
Average Inventory and Inventory Turnover
The average inventory formula is straightforward: add beginning inventory to ending inventory, then divide by 2.
(Beginning Inventory + Ending Inventory) / 2
Once you have that number, plug it into the inventory turnover ratio:
COGS / Average Inventory = Inventory Turnover Ratio
Here is a concrete example. A distributor starts the year with $200,000 in stock and ends with $160,000. Average inventory is $180,000. Annual COGS is $1,080,000. Divide and you get a turnover ratio of 6. That means the business cycled through its stock 6 times in a year.
Accurate counts are what make this math trustworthy. As GS1 notes, barcode standards underpin reliable scan-based counts at every receiving dock and pick station. See GS1 barcode standards for the full specification.
How COGS Is Calculated for Distributors
For a wholesale distributor, COGS follows one formula: beginning inventory plus buys minus ending inventory.
Beginning Inventory + Buys - Ending Inventory = COGS
Most of that figure is buy cost plus inbound freight. Labor and overhead are usually small or excluded entirely for pure distributors who do not manufacture anything.
The IRS makes this calculation mandatory, not optional. IRS Publication 538 states directly: "To figure taxable income, you must value your inventory at the beginning and end of each tax year." Your accounting package can automate COGS when inventory items are set up correctly, but the underlying data still has to be right.
Why Average Inventory Beats a Single Snapshot
Why use an average instead of just the ending balance? Because a single end-of-period number can be deeply misleading.
Inventory levels swing throughout any period. A bulk buy arriving on December 28 inflates your year-end balance. A seasonal selldown in November deflates it. Either snapshot tells a skewed story.
Averaging the beginning and ending values smooths those spikes. For a wholesale distributor with uneven order cycles, that smoothing is not a nice-to-have. It is the difference between a ratio that reflects real operations and one that reflects a lucky or unlucky date.
The average turns a moment into a trend, which is the only kind of number worth making decisions from.
The comparison is easier when one option is built for you
Off-the-shelf means fitting your process to the software. We do it the other way round, and the first look costs nothing.
Book a callInventory Turnover and Days Inventory Outstanding
Reading the Turnover Ratio
The inventory turnover ratio equals COGS divided by average inventory. A higher ratio means stock moves fast. A lower ratio means cash is sitting on shelves.
Consider 2 distributors with identical product lines. Distributor A turns inventory 6 times a year. Distributor B turns it 2 times. Distributor A needs far less working capital to run the same volume. That gap compounds over time.
Benchmarks vary by category. General wholesale distribution often runs between 4 and 8 turns per year, but the right number depends on your margins, your suppliers' lead times, and your customers' expectations. Chasing a benchmark without that context can push you into stockouts. A ratio that climbs too fast is a warning, not just a win.
Days Inventory Outstanding
Days Inventory Outstanding, or DIO, flips the turnover ratio into a time unit. The formula is:
(Average Inventory / COGS) x 365 = DIO
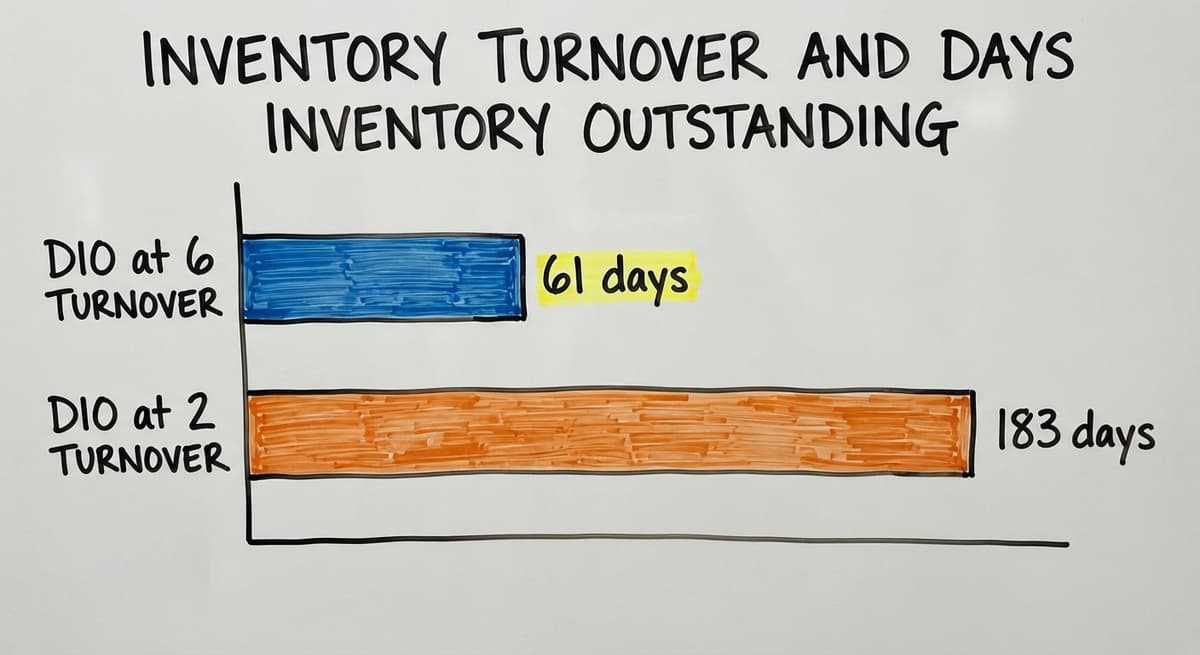
DIO tells you how many days stock sits before it sells. A distributor with a turnover ratio of 6 has a DIO of roughly 61 days. A distributor turning inventory only 2 times carries stock for about 183 days before it moves.
Turnover ratio and DIO carry the same information in different units. Use whichever one your team finds easier to act on.

GMROI: Profit Per Dollar of Stock
Gross Margin Return on Inventory Investment, or GMROI, adds a profitability layer the turnover ratio leaves out. The formula is gross profit divided by average inventory cost.
A distributor can turn inventory 8 times a year and still earn very little if margins are thin. GMROI surfaces that problem. A result above 1.0 means each dollar of inventory generated more than a dollar of gross profit. Below 1.0, the business is losing ground.
High turnover with low GMROI is a margin problem dressed up as an efficiency win. Track both before drawing conclusions about a product line.
What Mistakes Are Most Common When Calculating Average Inventory?
The most common mistake is using only 2 data points when monthly snapshots are available, which hides seasonal swings inside a single average.
Other errors that distort your numbers:
- Mixing costing methods mid-period, such as switching from FIFO (first in, first out) to weighted average cost without adjusting prior figures
- Forgetting stock in transit or held at a third-party warehouse, which understates true inventory value
- Pulling ending inventory from a date that does not align with the COGS period, so numerator and denominator measure different windows
- Using 12 monthly balances when you only have 2 reliable snapshots, then treating the result as if it were precise
The fix is not more math. It is cleaner, dated records captured at consistent intervals.
See it running on your own process first
No build cost. The subscription starts once it is live and doing the job, not before.
Book a callGetting a More Accurate Average
A 2-point average is a starting point. A 12-point average, using a snapshot taken on the same date each month, is far more reliable for any business with seasonal swings.
The formula: add all 12 monthly balances and divide by 12. That is it. The challenge is not the arithmetic. It is having consistent, dated inventory records to feed into it. Without a fixed monthly count date and a place to store each result, the data does not exist when you need it.

How Costing Methods Affect Your Numbers
Your inventory costing method changes both sides of the turnover formula at once.
- FIFO (first in, first out) assumes the oldest stock sells first. In a rising-cost environment, FIFO produces lower COGS and higher ending inventory values.
- LIFO (last in, first out) assumes the newest stock sells first, raising COGS and lowering inventory value. LIFO is not permitted under international accounting standards.
- Weighted average cost blends all buy prices into a single per-unit cost, smoothing price swings across the period.
None of these is universally correct. What matters is consistency. Switching methods mid-year changes both your COGS figure and your average inventory value, making year-over-year comparisons meaningless.
Know which method your accounting package applies to each item, and do not change it without adjusting your historical data to match.
Does Your Accounting Package Calculate Average Inventory Automatically?
An accounting package tracks COGS and inventory value automatically for items set up as inventory. It reports beginning and ending inventory for any period you choose. That covers the basic 2-point average. What it does not do natively is store mid-period snapshots for a 12-point average. Pulling monthly balances needs either a manual export on the same date each month or a third-party report. Multi-location stock, lot tracking, and real-time visibility usually need extra tooling.

Why Spreadsheet Workarounds for Average Inventory Create Hidden Costs
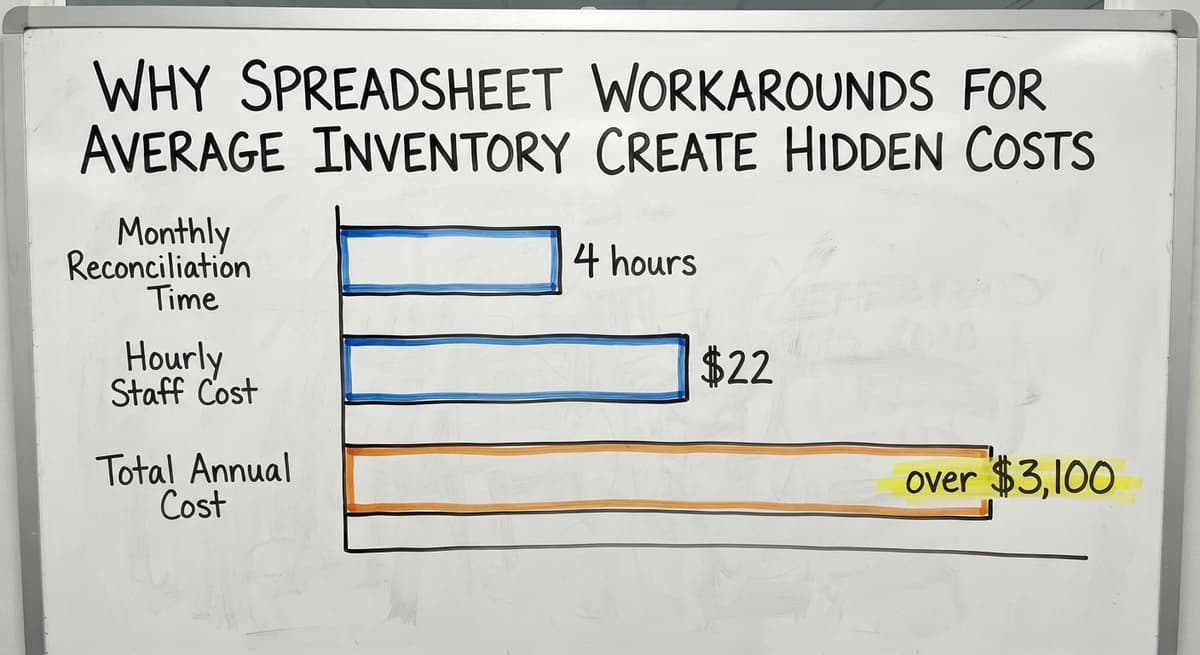
Many distributors solve this by exporting data into a spreadsheet and building their own average inventory calculation. The math is simple. The problem is maintenance: manual entry errors, version conflicts, stale exports, and no audit trail. 3 staff members spending 4 hours each month on manual matching at $22 an hour costs over $3,100 a year before a single error is counted. Data quality is the real constraint. Receiving errors, unrecorded transfers, and count discrepancies feed bad numbers into a formula that cannot tell the difference. Garbage in means garbage out, and the purchasing decisions built on that output are wrong before they are made.
Not sure this is the right shape for your operation
Describe how the work runs today. We map it on a call and show you what it would look like built around that, before you spend anything.
Book a callHow Can Inventory Management Software Improve COGS Average Inventory Tracking?
Purpose-built inventory management software for wholesale distributors records every stock movement in real time with a timestamp. That makes it easy to pull an accurate monthly snapshot without a manual export or a spreadsheet. Dated records feed directly into the average inventory calculation. The system does the math rather than requiring a person to remember to run a report on the right date. Better data means the turnover ratio and DIO figures reflect what actually happened, not what the last count happened to show.

How Real-Time Inventory Accuracy Changes Downstream Purchasing Decisions
Accurate average inventory data changes downstream decisions. A falling turnover ratio by SKU signals slow-moving stock before it becomes a write-off. A rising ratio by category flags under-stocking before a customer calls about a missed shipment. The US Federal Trade Commission is clear that sellers must ship when promised, and an accurate stock count is what makes that promise keepable. Real-time inventory data turns a lagging report into a live decision tool.
Keeping Your Accounting Package While Fixing the Gap
Replacing your accounting package is not necessary. Custom warehouse management software can sit alongside it, handling receiving, picks, and stock tracking. COGS data flows back into the accounting package for financial reporting.
This fills the gap rather than forcing a full system replacement. The accounting package keeps doing what it does well. The inventory layer handles the movement data, the dated snapshots, and the multi-location visibility that the accounting package was never designed to provide.
Practical Steps to Start Tracking COGS Average Inventory Accurately
Tracking COGS average inventory correctly needs no new software to start. Follow these 4 steps:

- Confirm your costing method is consistent across all items in your accounting package. Mixed methods produce mixed-up numbers.
- Set a fixed date each month to record inventory balances. The same date every month is more important than which date you pick.
- Capture stock at every location, including goods in transit and any inventory held at a third-party warehouse or fulfillment center.
- Store each snapshot with its date so you can build a true multi-point average at year end rather than falling back on 2 numbers.
When manual tracking takes more than a few hours a month, or when count discrepancies keep showing up, those are working signals that the process has outgrown the tools. A custom-built system can be scoped to the actual problem without forcing a full ERP migration.
Describe your current process and a solution can be sized to fit, not the other way around.
Frequently asked questions
At what point are COGS used with inventory?
COGS is used with inventory whenever you need to measure how quickly stock converts to revenue. The most common application is the inventory turnover ratio: divide COGS for a period by average inventory for that same period. You also use COGS with inventory at tax time, since the IRS needs you to value inventory at the start and end of each tax year to calculate taxable income.
How to get average inventory at cost?
Add your beginning inventory value to your ending inventory value, then divide by 2. Both figures should be recorded at cost, not at retail price. For a more accurate result, use monthly snapshots instead of just 2 data points: add all monthly balances and divide by the number of months. Make sure you use the same costing method, such as FIFO or weighted average cost, for every figure in the calculation.
What is a good inventory ratio?
There is no single right answer. General wholesale distribution commonly runs between 4 and 8 inventory turns per year, but the right number depends on your product category, supplier lead times, and margin structure. A ratio that is too low means cash is tied up in slow-moving stock. A ratio that is too high can signal stockouts and lost sales. Compare your ratio to your own prior periods before comparing it to an industry benchmark.
How to calculate COGS from inventory?
Use this formula: Beginning Inventory plus Buys minus Ending Inventory equals COGS. For a wholesale distributor, buys include the cost of goods bought from suppliers plus inbound freight. Your accounting package calculates this automatically when inventory items are set up correctly, but the result is only as reliable as the receiving and count records feeding into it.
What is the inventory turnover ratio and why does it matter?
The inventory turnover ratio equals COGS divided by average inventory. It tells you how many times you cycled through your stock in a given period. A higher ratio generally means less cash tied up in inventory and faster revenue conversion. A lower ratio points to slow-moving stock or over-purchasing. The ratio is more useful than looking at COGS or inventory value alone because it connects cost to the stock that generated it.
What is days inventory outstanding and how does it relate to the turnover ratio?
Days Inventory Outstanding, or DIO, measures how many days stock sits before it sells. The formula is: (Average Inventory divided by COGS) multiplied by 365. DIO and the inventory turnover ratio carry the same information in different units. A turnover ratio of 6 equals a DIO of roughly 61 days. Use whichever format is easier for your team to act on.
Why is a 2-point average sometimes not accurate enough?
A beginning and ending balance can both land on unusual dates, such as after a large buy or during a seasonal low. When that happens, the 2-point average reflects those extremes rather than typical stock levels. Using 12 monthly snapshots, taken on the same date each month, produces an average that reflects how inventory actually behaved across the full year. This matters most for businesses with strong seasonal swings or uneven order cycles.
Can I keep my current accounting package and still improve inventory tracking?
Yes. Custom warehouse management software can sit alongside your existing accounting package, handling receiving, picks, stock movements, and dated snapshots. COGS and inventory data flow back into the accounting package for financial reporting. This approach fills the gap in mid-period visibility without replacing the financial tools your team already knows.
Start with a free first look
A 30 minute call, your operation mapped, and a clear picture of what we would build. No obligation and nothing to install.
Book a callRelated guides
The rest of this guide, for the parts of the job this page does not cover.
Guides
- Average Days to Sell Inventory Formula
- Classification of Inventory
- Excess Inventory
- Closed for Inventory
- Multi Location Inventory Management Software
- Ms Excel Inventory Template
- Inventory Management for Multiple Locations
- Costing Inventory
- Is Inventory a Long-term Asset
- Inventory Management System for Manufacturing
- Inventory Fixed Assets
- Inventory Management Pics
- Inventory Monitoring
- Excel Inventory Template
- Push and Pull Inventory
- Types of Inventory Control
- Consumable Inventory
- B2b Inventory Management
- Jewelry Inventory Management
- Dental Inventory Management
- The Objective of Inventory Management is To