

Inventory Economics Definition
Inventory economics definition: the study of what it costs to hold stock and how that affects profit and cash. Plain costs, an example and data needs.
Book a callWhat Is the Inventory Economics Definition?
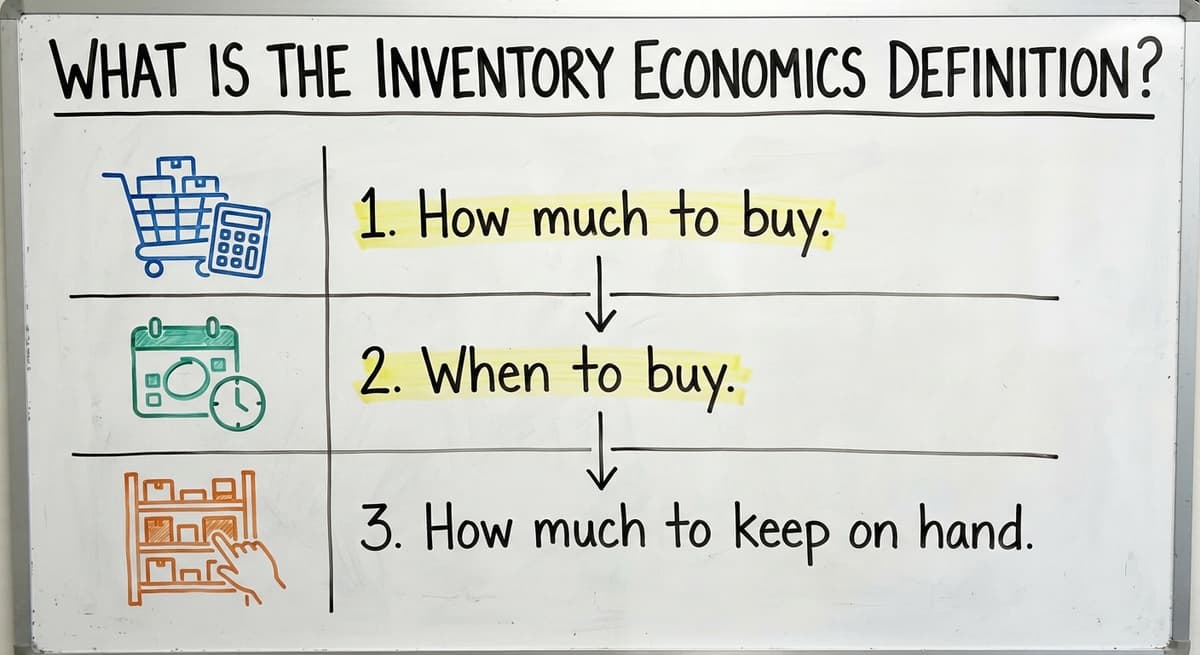
The inventory economics definition is short. Inventory economics is the study of the costs and benefits of holding stock, and how those choices affect profit and cash.
Reviewed November 2026.
The field answers 3 questions:
- How much to buy.
- When to buy.
- How much to keep on hand.
Every stocking choice a distributor makes is one of those 3 answers.
We build it for your operation, and the first look is free
If you would rather not compare products, describe how your operation already works and we build the system around it.
No build cost. You see it running on your own process first, and the monthly subscription starts only once it is live.
Book a callWhy Inventory Economics Matters for Wholesalers and Warehouses
Stock is cash sitting on a shelf. For many distributors it is the biggest asset on the books. The US Census Bureau tracks wholesale inventories and sales every month for this reason.
Too much stock ties up money. Too little loses sales and customers. Small and mid-size shops feel the swings first. They have less cash cushion.
The law also cares about the count. IRS Publication 538 says, "To figure taxable income, you must value your inventory at the beginning and end of each tax year." A scan-based count helps here, and GS1 publishes the "standards" behind barcodes. Good inventory management for wholesalers starts with a count you can trust.
What Are the Main Costs of Holding Inventory?
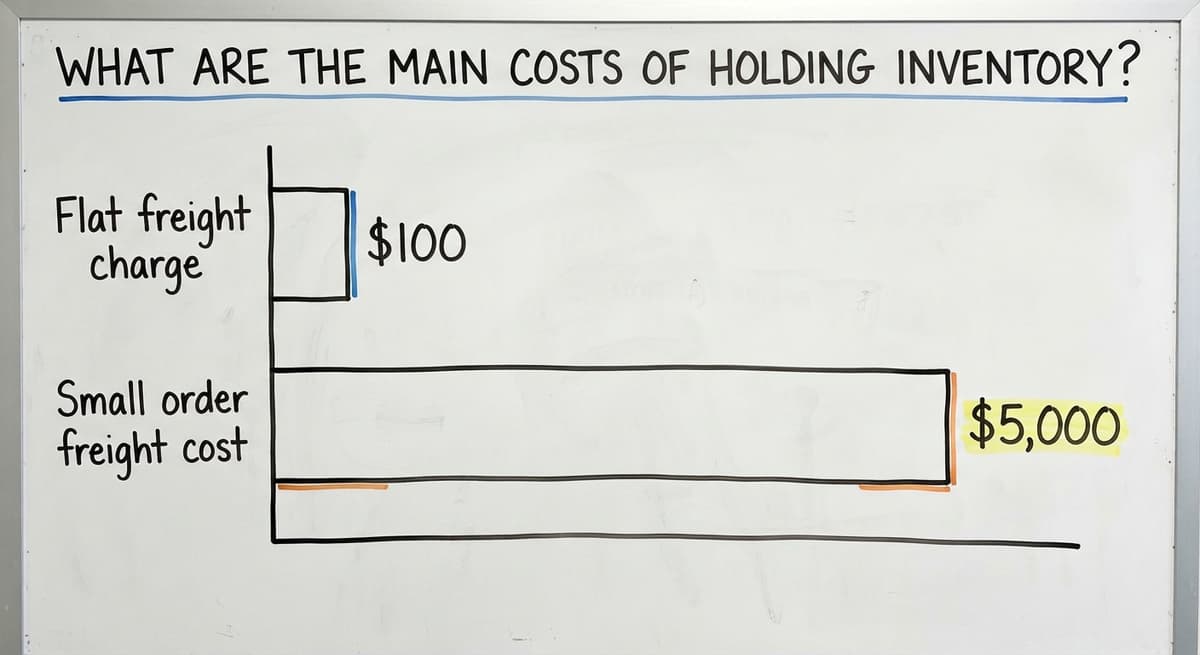
The main costs are ordering costs, holding costs and stockout costs. Each one grows or shrinks as you change how much you buy and how often. The next 3 parts cover them one at a time.

Ordering Costs
Ordering costs are what you pay each time you place an order. They include staff time, freight, receiving and paperwork.
Say a supplier charges a flat $100 for freight. Placing 50 small orders costs $5,000 a year in freight alone. Placing 10 larger orders costs $1,000. Bigger batches spread the fixed fee over more units. Fewer, larger orders cut the ordering cost of each unit.
Holding Costs
Inventory holding costs, also called the carrying cost of inventory, are what it costs to keep stock. They cover storage space, handling and insurance. They also cover shrinkage (loss and theft), spoilage and stock that goes stale.
The biggest piece is the cash tied up. Teams show holding cost as a percent of stock value per year. Each business sets its own rate, so work out yours.
Larger orders raise holding cost. That is why it pulls against ordering cost. Every extra pallet on the shelf has a yearly price.
Stockout Costs
A stockout is the moment you run out of an item a customer wants. The costs are lost sales, rush shipping, back orders and unhappy buyers.
A missed order for a key account can cost more than the margin on the item. The buyer may move the whole account to another supplier.
Stockout cost is easy to miss. No report shows it as a line. The cost is real even when the books never record it.
Not sure this is the right shape for your operation
Describe how the work runs today. We map it on a call and show you what it would look like built around that, before you spend anything.
Book a call
How Inventory Economics Finds the Right Balance
The balance is a trade-off. Ordering more often costs more in orders. Ordering less often costs more in holding. The best order size sits where the 2 costs meet.
The classic method is economic order quantity, or EOQ. It is the order size with the lowest total of ordering and holding cost.
Two tools guard against stockouts:
- Safety stock is the extra units you keep in case demand jumps or a delivery runs late.
- A reorder point is the stock level that tells you to place the next order.
The formulas only work when the numbers behind them are right. A wrong count or a stale supplier price gives a wrong answer. Clean data comes first.
A Simple Example
The example of weekly versus monthly ordering is made up. A distributor sells 200 units a week of one fast item. Each unit costs $50. Freight is a flat $100 per order. Assume holding cost is 20% of stock value per year.
- Weekly orders: 52 orders cost $5,200 in freight. Average stock is about 100 units, or $5,000. Holding cost is $1,000.
- Monthly orders (every 4 weeks): 13 orders cost $1,300 in freight. Average stock is about 400 units, or $20,000. Holding cost is $4,000.
Monthly ordering saves $3,900 in freight. It adds $3,000 in holding cost and ties up $15,000 more cash. The net gain is only $900. A bigger order is not always the cheaper one.

What Data Do You Need to Apply Inventory Economics?
You need 5 kinds of data: current counts, sales history, lead times, supplier costs and carrying costs. Lead time is the wait between placing an order and getting the goods.
A small business without a big ERP can use these ideas. A spreadsheet is enough to start. The trouble comes when the data lives in an accounting package, Excel sheets, Access databases and email. Nobody trusts the numbers then.
A custom tool built around how your team already works can pull these pieces together. It replaces only the manual parts. Your accounting software stays where it is useful. The NIST Manufacturing Extension Partnership offers vendor-neutral guidance on supply chain and inventory process.
The Software Society can review your current process with you and map what to fix first. Clean data turns the formulas from theory into daily decisions.
Frequently asked questions
What is the definition of inventory economics?
Inventory economics is the study of the costs and benefits of holding stock, and how those choices affect profit and cash. It answers how much to buy, when to buy and how much to keep on hand.
What is economic order quantity in simple terms?
Economic order quantity, or EOQ, is the order size with the lowest total of ordering cost and holding cost. Bigger orders cut ordering cost. Smaller orders cut holding cost. EOQ finds the middle.
What is the trade-off between ordering costs and holding costs?
Ordering often raises your order costs but keeps stock low. Ordering rarely cuts order costs but raises storage and cash tied up. The right order size balances the 2.
Can a small business without a big ERP use these ideas?
Yes. A spreadsheet with counts, sales history, lead times and costs is enough to start. The ideas work as long as the numbers are accurate.
Start with a free first look
A 30 minute call, your operation mapped, and a clear picture of what we would build. No obligation and nothing to install.
Book a callRelated guides
More on the same work.
Guides
- Best Inventory Software
- Classification of Inventory
- Excess Inventory
- Closed for Inventory
- Multi Location Inventory Management Software
- Ms Excel Inventory Template
- Inventory Management for Multiple Locations
- Costing Inventory
- Is Inventory a Long-term Asset
- Inventory Management System for Manufacturing
- Inventory Fixed Assets
- Inventory Management Pics
- Inventory Monitoring
- Excel Inventory Template
Common questions
- What is the Definition of Inventory Management
- Inventory Asset Definition
- Stock Inventory Definition
- Inventory Account Definition
- Definition of Warehouse Management System
- How to Keep Track of Inventory
- What is the Difference Between Aggregate and Item Inventory Management
- What is Jit Inventory Management
- What is Kanban System of Inventory Management
- Mro Inventory Meaning