

Kpi Warehouse
A KPI warehouse is not a building. It is the set of key performance indicators used to measure how well a warehouse runs. This guide, reviewed in September 2026, covers the 18 KPIs worth tracking, the good number for each at a warehouse of 5 to 100 people, and how to start with 3.
Reviewed August 2026. Each figure comes from the assumptions stated beside it, so you can substitute your own and the arithmetic still holds.
Published 11 August 2026. Reviewed and updated 15 September 2026.
Book a callWhat Is a KPI Warehouse?
A KPI, or key performance indicator, is a number tied to a goal. A KPI warehouse is the full set of those numbers applied to warehouse operations.
Think of it as a health check for your operation. Each KPI tells you whether one part of the warehouse is working or needs attention.
This is a management concept, not a piece of software. You can run a KPI warehouse on a whiteboard if you have to. The point is to replace gut feel with a repeatable signal you can act on.
Would you rather have it built around your operation?
The first look is free. If you would rather not compare products, describe how your operation already works and we build the system around it.
No build cost. You see it running on your own process first, and the monthly subscription starts only once it is live.
Book a callWhy Does Gut Feel Break Down as a Warehouse Grows?
Gut feel works when you have 5 people. It breaks down fast at 20 or 50.
You feel like shipping is slow, but without a pick rate number you cannot tell whether the problem is people, process, or layout. A number gives you a place to start.
OSHA notes that "The warehousing and storage industry includes establishments operating facilities for general merchandise, refrigerated goods, and other products," and OSHA's warehousing guidance makes clear that tracking what happens on the floor is part of running the operation safely and well.
What Is the Difference Between a Warehouse Metric and a Warehouse KPI?
A metric is any number you can measure. A KPI is a metric tied to a goal. Units picked per hour is a metric. Units picked per hour compared to your 95-unit target is a KPI.
A KPI without a target is just data noise. If you have a spreadsheet full of numbers but no targets next to them, you have metrics, not KPIs. The fix is simple: pick the numbers that matter most and write a target beside each one.
Most warehouse owners already have some numbers in a spreadsheet. The job is to filter them. Ask two questions about each number:
- Does this number change when something goes wrong?
- Do I have a target for it?
If both answers are yes, it is a KPI. If either answer is no, it is background data.
Receiving KPIs Every Warehouse Should Track
Receiving is where errors start. A wrong count at the dock becomes a wrong count everywhere downstream.
The two KPIs that catch those errors earliest are dock-to-stock time, which measures how long it takes a shipment to move from arrival to a usable location, and receiving accuracy rate, which measures how often the count and condition recorded at the dock match the purchase order.
Tracking both gives you a clear signal about whether receiving is a bottleneck and whether your team is catching supplier errors before they spread.
The 3 Receiving KPIs That Matter Most
- Receiving accuracy rate is the share of inbound shipments matched correctly to the purchase order
- Dock-to-stock time: how long from truck arrival to product on the shelf
- Vendor fill rate: how often suppliers deliver exactly what was ordered
Slow or inaccurate receiving creates errors in inventory counts that take weeks to find.
If your dock-to-stock time runs over 4 hours, product sits in a grey zone where the system says it is not here but the truck says it is. That gap causes mis-picks and frustrated customers.
The Warehousing Education and Research Council publishes benchmark data on distribution center performance, including receiving metrics, that you can use as a starting point when your own history is thin.
Is the comparison easier when one option is built for you?
Yes. Off-the-shelf means fitting your process to the software, and custom is the other way round. The first look costs nothing.
Book a callInventory Accuracy KPIs
Inventory accuracy is the gap between what your system says you have and what you actually have. Most small warehouses running standard accounting software have no live inventory accuracy number at all. That gap is the first one to close.
The IRS is direct about why this matters beyond operations. IRS Publication 538 states: "To figure taxable income, you must value your inventory at the beginning and end of each tax year." Accuracy is a legal obligation, not just a management preference.
3 Inventory KPIs to Watch
- Inventory accuracy rate: physical count versus system count, expressed as a percentage
- Shrinkage rate: value lost to damage, theft, or admin error
- Cycle count frequency: how often you verify specific SKU counts rather than doing one big annual count
Cycle counting, where you check a small group of SKUs each week, catches errors early. A full annual count finds problems after months of damage have already happened.
Order Fulfillment KPIs
Three numbers tell you whether the warehouse is keeping its promise to customers.
| KPI | What It Measures | Why It Matters |
|---|---|---|
| Order accuracy rate | Orders shipped with the right items and quantities | Errors cost money and trust |
| On-time shipment rate | Orders shipped by the promised date | Customers notice late shipments first |
| Order cycle time | Minutes or hours from order receipt to shipment | Speed is a competitive edge |
These 3 order fulfillment KPIs work together. A high on-time shipment rate with a low order accuracy rate means you are shipping fast and wrong. You need all 3 moving in the right direction at once.

Pick Rate and Labor Productivity KPIs
Labor is the biggest warehouse cost. The US Bureau of Labor Statistics tracks wages for warehouse workers across the country.
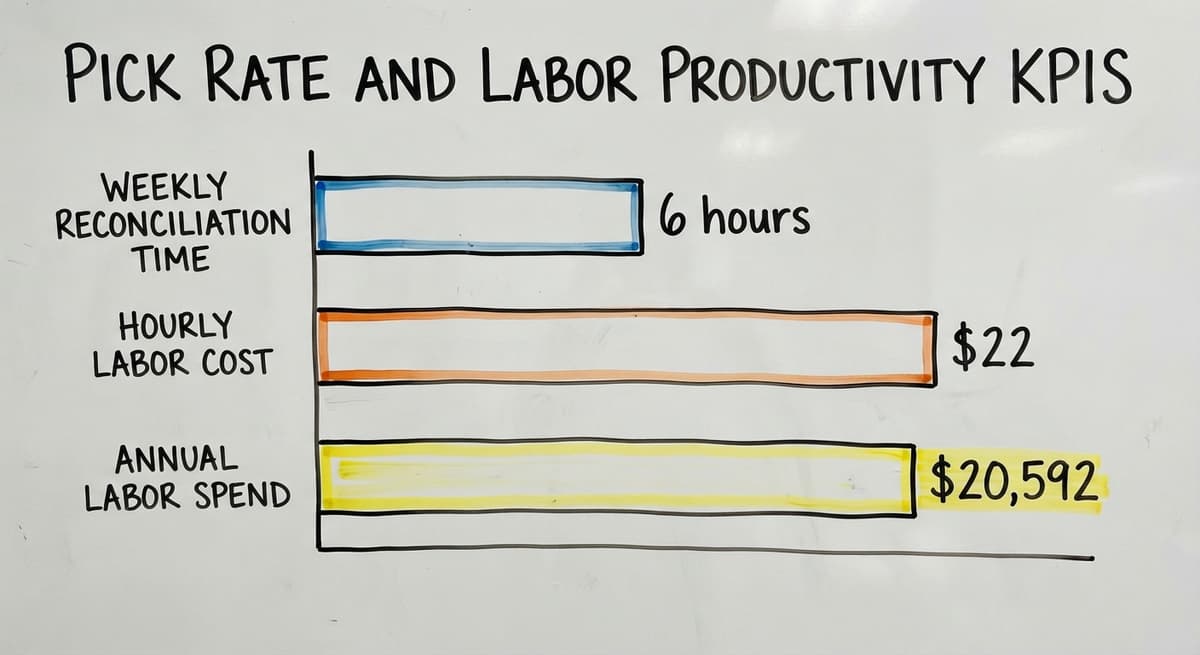
If 3 people spend 6 hours a week manually reconciling pick sheets at $22 an hour, that is $20,592 a year in labor spent on a process that a simple system could handle in minutes.
Key Labor KPIs
- Order lines completed per hour, per person is the most common warehouse labor KPI
- Cost per order: total warehouse labor cost divided by orders shipped in the period
- Overtime percentage: overtime hours as a share of total hours, a leading indicator of staffing stress
A high pick rate paired with a high error rate is not a win. Labor KPIs need context. Speed without accuracy just moves the problem downstream to returns and customer complaints.
Storage and Space Utilization KPIs
Before signing a bigger lease, check these 3 numbers.
- Storage utilization rate: the share of available bin or rack space in use
- Inventory turns: how many times total inventory sells and is replaced in a year
- Dead stock percentage: SKUs with zero movement in the past 90 or 180 days
The US Census Bureau's Monthly Wholesale Trade data tracks the national inventories-to-sales ratio for wholesale firms. If your inventory turns are well below your sector's ratio, dead stock is likely the cause, not a space shortage.
Fixing slow-moving product is cheaper than renting more space. These KPIs help you make that call with numbers rather than a feeling.
What Are the Most Common Returns and Damage KPIs?
Returns and damage rates answer directly: the 3 numbers to watch are return rate, damage rate, and cost per return.
- Return rate: returns divided by total orders shipped
- Damage rate: units damaged in the warehouse divided by total units handled
- Cost of returns: labor and restocking cost per return
High return or damage rates trace back to picking errors or poor receiving inspection. If your order accuracy rate is low, your return rate will follow. The numbers connect. Fixing the root cause upstream lowers the cost downstream.

How to Set a the software for Each KPI
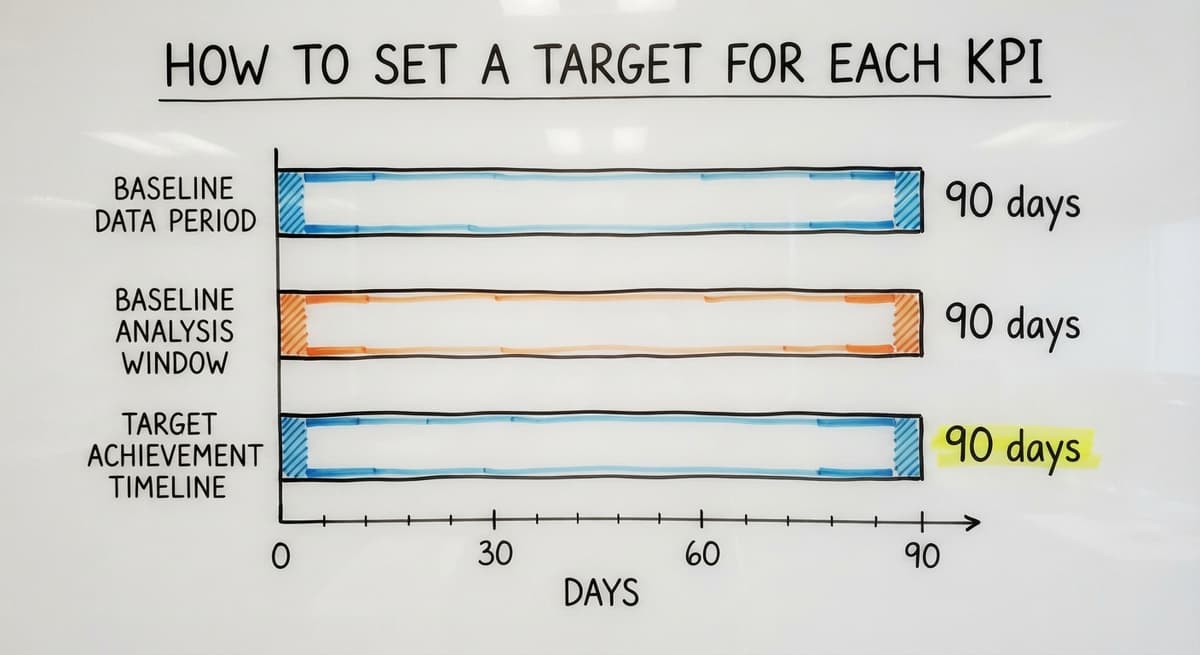
Start with your own history, not a benchmark from an article you cannot verify. Pull the last 90 days of data for each KPI and use that as your baseline. Then set a realistic improvement goal for the next 90 days.
A target no one believes in will be ignored. If your current on-time shipment rate is 78 percent, setting a 99 percent target for next month will not motivate anyone. A target of 85 percent in 90 days is achievable and worth chasing.
Review targets quarterly. As the operation changes, the targets should change with it. The NIST Manufacturing Extension Partnership offers vendor-neutral guidance on setting supply chain process goals that applies well to small warehouse operations.
What does it look like running on your own process?
The first thing you see is it running on your own process, at no build cost. The subscription starts once it is live and doing the job, not before.
Book a callWhat Do Good KPI Numbers Look Like for Small Warehouses?
Warehouse KPI benchmarks are reference points, not rules. Starting points vary widely. The goal is improvement, not instant perfection.
| KPI | Common Reference Point |
|---|---|
| Inventory accuracy rate | Above 97% |
| On-time shipment rate | Above 95% |
| Order accuracy rate | Above 99% |
| Storage utilization rate | 85% to 90% before expansion makes sense |
A good inventory accuracy rate for a warehouse is above 97 percent, based on benchmarks from the Warehousing Education and Research Council. If you are at 91 percent today, getting to 95 percent in the next quarter is a strong goal.
Why Do Most Small Warehouses Have No Live KPI Data?
Inventory lives in your accounting software. Picking, receiving, and returns are tracked on paper or in a spreadsheet. No single system connects those numbers.
So calculating a KPI means pulling data from 3 places, doing the math by hand, and hoping nothing changed while you were doing it.
That process takes time no one has. This is a structural problem, not a people problem. The root cause is fragmented tools, not bad management.
The result is that most small warehouses review KPIs monthly at best, which turns a management tool into a history report. By the time you see a problem in a monthly summary, it has already cost you money.
Custom warehouse inventory management software overview starts here: one layer that connects the data sources you already use.

How Do I Track Warehouse KPIs Without Replacing Your Accounting Software?
Your accounting software handles accounting well. Keep it for that purpose. The fix is an operational layer that sits alongside it, not a replacement for it.
A focused tool can capture pick, receive, and ship events in real time. The KPIs calculate automatically from live data rather than end-of-week spreadsheet work. This approach avoids a full ERP migration and the cost and disruption that comes with it.
Linking your accounting software to warehouse operations is a practical starting point for most warehouses under 100 staff. You keep the accounting system your team already knows. You add the operational data capture you are missing. The two systems share data rather than compete.
Inventory tracking without an ERP is possible when the tool follows your workflow rather than asking you to change it.
Building a Simple KPI Dashboard for Your Warehouse
A warehouse dashboard does not need to be fancy. It needs to show the right 5 to 8 numbers at a glance, updated daily.
Update frequency matters more than visual design. A daily number you act on beats a beautiful weekly chart you admire. Assign one owner to each KPI so someone is accountable for it.
Two setups that work well:
- A shared screen mounted in the warehouse showing live numbers
- A morning email report sent to the manager and team leads before the shift starts
Either works. The key is that the numbers are visible, current, and owned by a named person.
What Mistakes Do Warehouse Managers Make With KPIs?
The most common mistakes are easy to avoid once you know them.
- Tracking too many KPIs at once so none get real attention
- Measuring outputs without measuring inputs, for example tracking on-time shipment but not pick accuracy
- Setting targets based on industry articles rather than your own operation's history
- Updating the dashboard monthly instead of daily, turning a management tool into a history report
Start with 3 KPIs. Track them well. Add more only when the first 3 are stable and trusted.
What is in a free first look?
A 30 minute call, your operation mapped, and a clear picture of what we would build. No obligation and nothing to install.
Book a call
How Often Should You Review Warehouse KPIs?
The right review frequency is the speed at which a problem can grow.
| KPI Type | Review Frequency |
|---|---|
| Pick rate, on-time shipment | Daily or per shift |
| Inventory accuracy, storage utilization | Weekly |
| Inventory turns, cost per order | Monthly |
| Targets themselves | Quarterly |
Operational KPIs like pick rate change every shift. If you only look at them weekly, a problem that started Monday costs you all week. Strategic KPIs like inventory turns move slowly and a monthly look is enough.
Using KPIs to Have Better Conversations With Your Team
A KPI gives a manager a neutral starting point rather than a complaint. Showing a team member their pick rate trend over 4 weeks is more useful than saying they seem slow. The number is the subject of the conversation, not the person.
KPIs also surface systemic problems that are not the fault of any individual. If 6 pickers all show declining pick rates in the same week, the problem is probably layout, product placement, or a process change, not 6 people suddenly getting worse at their jobs.
Custom warehouse software for small distributors built around your real workflow makes this kind of conversation easier because the data is current and specific, not a manual estimate from last week.
When Are You Ready to Automate Your KPI Tracking?
Three signs you are ready:
- You know which KPIs matter to your operation
- You have a 30-day baseline for each one
- Manual tracking is taking more than an hour a week of someone's time
At that point, custom software built around your existing workflow can capture KPI data as a byproduct of daily work. Pickers scan, receivers confirm, and the system records the event. The KPI updates without anyone doing extra work.
Fulfillment center software solutions designed for small operations connect to your accounting software and cost a fraction of a full ERP.
For a warehouse with 10 to 80 staff, a focused operational tool is enough. Teams in Columbus, Ohio and across the country have made this move without a painful migration or months of retraining.

Start With 3 KPIs and Build From There
Pick one KPI from each of these 3 areas:
- Receiving: dock-to-stock time
- Fulfillment: on-time shipment rate
- Inventory: inventory accuracy rate
Track them manually for 30 days. Write the numbers down every day. At the end of 30 days you will have a baseline, and you will know whether your gut feel was right.
How Do You Expand Your KPI Set Without Losing Control?
Once you trust those 3 numbers, add 2 or 3 more. Do not add all 15 KPIs from this guide at once. The goal is a system you actually use, not a dashboard that looks complete and gets ignored.
The next step is a conversation with a local software team that builds around your operation rather than asking you to change it. Describe what you track today, where the gaps are, and what a good week looks like.
A focused tool built on that conversation will serve you far better than any off-the-shelf system built for a warehouse three times your size.
Frequently asked questions
Frequently asked questions
What is KPI in warehouse?
A KPI in a warehouse is a number linked to a specific goal that tells you whether one part of the operation is working or needs attention.
Examples include pick rate, how often orders ship on time, and how closely counted stock matches your records. A number without a target is just a metric; a number measured against a goal is a KPI.
What are the top 5 key performance indicators (KPIs) for warehousing?
There is no single right answer because priority KPIs depend on where your operation carries the greatest risk. That said, the 5 most commonly tracked warehouse KPIs are: how well counted stock matches your records, how often orders ship on time, how often orders ship correct, order lines completed per hour, and dock-to-stock time.
Start with these if you are building a KPI program from scratch.
What are some good KPI examples?
Good KPI examples for a warehouse include: how closely a physical count matches the system count, expressed as a percentage; how many orders ship by the promised date out of the total; order lines completed per hour, per person; the share of orders that go out with the right items; and dock-to-stock time, the hours from truck arrival to product on the shelf. Each one is measurable, actionable, and linked to a clear goal.
What are the 5 key performance indicators?
In a warehouse context, the 5 key performance indicators most operations should track are how closely stock counts match records, how often orders ship correct, how often they ship on time, pick rate, and cost per order. These 5 cover receiving quality, fulfillment speed, labor productivity, and customer-facing performance.
Track all 5 together rather than in isolation, because a strong number in one area can hide a problem in another.
What is a good inventory accuracy rate for a warehouse?
A commonly cited reference point is 97 percent or above, based on distribution center benchmarks from the Warehousing Education and Research Council.
If your current rate is below 95 percent, closing that gap is the highest-value move you can make before tracking any other KPI. What matters most is steady improvement from your own baseline, not instant perfection.
How do I track warehouse KPIs without replacing your accounting software?
Keep your accounting software for accounting and add a focused operational tool alongside it. The operational layer captures pick, receive, and ship events in real time and calculates KPIs automatically.
The two systems share data rather than compete. This avoids a full ERP migration and lets your team keep using the accounting system they already know.
Which KPIs should a small warehouse track first?
Start with one KPI from each of 3 areas: dock-to-stock time from receiving, how often orders ship on time from fulfillment, and how well recorded stock matches the physical count from inventory.
Track all 3 manually for 30 days to build a baseline. Once you trust those numbers, add pick rate and how accurately orders ship. Five well-tracked KPIs are worth more than fifteen that nobody looks at.
What is pick rate and why does it matter?
Pick rate is the number of order lines a single picker completes per hour. It is a common warehouse labor KPI because labor is the biggest warehouse cost.
A low pick rate raises what you spend per order and slows shipments. A high pick rate with a high error rate means speed is creating returns. Track pick rate alongside how accurately orders ship to get the full picture.
What are the most important warehouse KPIs?
The most important warehouse KPIs span receiving, inventory, fulfillment, labor, and storage.
Key ones include receiving accuracy rate, dock-to-stock time, how well stock records match the physical count, shrinkage rate, how often orders ship correct, how often they ship on time, order cycle time, order lines completed per hour, what each order costs to fulfill, and storage utilization.
Rather than tracking everything, pick a handful that change when something goes wrong and set a clear target for each, since a number without a target is just data, not a KPI.
How do you calculate warehouse productivity?
Warehouse productivity is calculated using labor KPIs such as order lines completed per hour, per person, which is a common measure, and what it costs to fulfill each order, found by dividing total warehouse labor cost by orders shipped in a period.
Overtime percentage also matters as a leading indicator of staffing stress. A high pick rate paired with a high error rate is not real productivity, since speed without accuracy just pushes problems downstream into returns and complaints.
How can I create a warehouse KPI dashboard?
Start small rather than trying to track everything at once. Choose three KPIs that clearly change when something goes wrong and that already have a target attached, then build a simple tracking sheet or whiteboard around them.
Add more indicators only once those are being reviewed regularly and acted on. The aim is a repeatable signal you can check often, not a complex system, so simplicity and consistency matter more than the tool used.
What are typical warehouse KPI benchmarks?
Typical warehouse KPI benchmarks vary by operation, but some reference points are useful. Dock-to-stock time running over four hours is considered a warning sign, since product sits in a gap where system records and physical stock disagree, causing mis-picks.
For inventory turns, comparing your rate to your sector's inventories-to-sales ratio helps reveal whether slow movement points to dead stock rather than a genuine space shortage.
Not sure this is the right shape for your operation?
The call is free. Describe how the work runs today. We map it on a call and show you what it would look like built around that, before you spend anything.
Book a callRelated guides
The rest of this guide, for the parts of the job this page does not cover.
Guides
- Warehouse Inventory Management Software
- Warehouse Inventory Tracking Software
- Warehouse Inventory Management Systems
- Pick and Pack in Warehouse
- Warehouse Receiving Software
- Warehouse Inventory Systems
- Warehouse Stock Management Software
- Warehouse Management System Top 10
- Software for Warehouse Management System
- Warehouse Shipment
- Warehouse Tracking System
- Warehousing Operations
- Inventory and Warehouse Management Software
- Small Business Warehouse Management System
- Cloud Based Warehouse Management
- Warehouse Management System Types
- Warehouse Inventory Management System
- List of Warehouse Management Software
- Warehouse Management Costs
- Warehouse Management Cloud
- Warehouse Management System Examples