


What Is Kpi In Inventory Management
KPI stands for Key Performance Indicator. In inventory management, a KPI is a number that tells you whether a specific part of your operation is working or needs attention. The most common inventory KPIs measure stock levels, order accuracy, how fast products move, and the cost of holding goods. Tracking them consistently is what separates a well-run warehouse from one that runs on guesswork.
Reviewed October 2026
Book a callWhat a KPI Is in Inventory Management
A KPI is a number tied to a specific outcome. It does not describe everything at once. It answers one question: is this part of the operation performing as expected?
In inventory management, KPIs cover things like how fast stock sells, how often orders ship correctly, and how much cash sits tied up on shelves. Each number points to a decision. A low turnover rate says to look at purchasing. A high stockout rate says to look at replenishment.
KPIs only help when you track them on a fixed schedule, not just when something goes wrong. A number checked once is a data point. A number checked weekly becomes a trend you can act on.
We build it for your operation, and the first look is free
If you would rather not compare products, describe how your operation already works and we build the system around it.
No build cost. You see it running on your own process first, and the monthly subscription starts only once it is live.
Book a callWhy KPIs Matter for Distributors and Warehouses
Without measured numbers, decisions come from gut feel. Gut feel leads to overstock on slow items and stockouts on fast ones. It leads to missed shipments and write-offs that quietly eat margin.
Small and mid-size wholesale operations often run on an accounting package and spreadsheets. Key data sits in separate files, and pulling it together takes time nobody has. The US Census Bureau tracks inventories-to-sales ratios for wholesale firms nationally, and even small swings in that ratio show how quickly inventory costs compound across a distribution business.
GS1, the global standards body behind product spotting, notes that "barcodes are the foundation of supply chain visibility" in its barcode standards records. That visibility is what makes consistent KPI tracking possible at the receiving dock and the shipping door.
Consistent KPI tracking produces real outcomes: fewer write-offs, faster fulfillment, and less time spent putting out fires every morning.
Inventory Turnover Rate: How Many Times Do You Sell Through Your Stock?
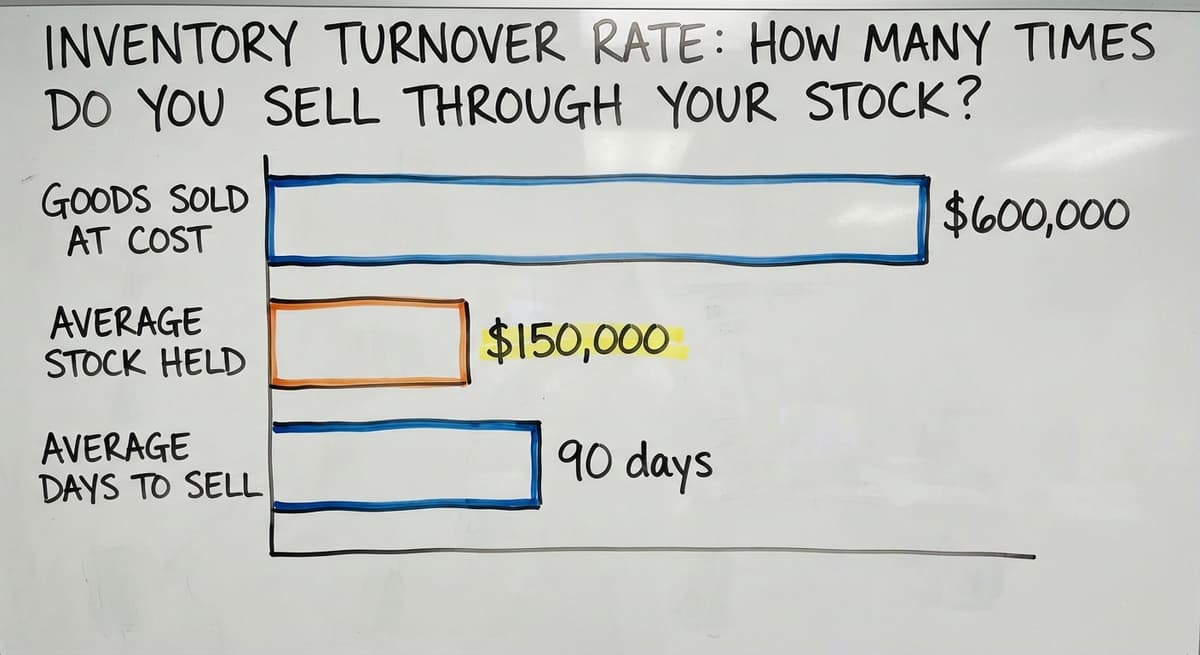
Inventory turnover measures how many times you sell and replace your stock in a given period, usually a year. The formula is Cost of Goods Sold divided by Average Inventory.
A wholesale distributor selling $600,000 in goods at cost, while holding an average of $150,000 in stock, turns inventory 4 times per year. That means every dollar of stock converts to a sale roughly every 90 days.
- A low turnover rate signals slow-moving stock tying up cash that could fund other buys.
- A high turnover rate signals lean stock, which risks leaving customers waiting if a reorder is delayed.
Neither extreme is automatically good. The right number depends on your product category and lead times. What matters is knowing your number and watching it move.
The comparison is easier when one option is built for you
Off-the-shelf means fitting your process to the software. We do it the other way round, and the first look costs nothing.
Book a callOrder Accuracy Rate
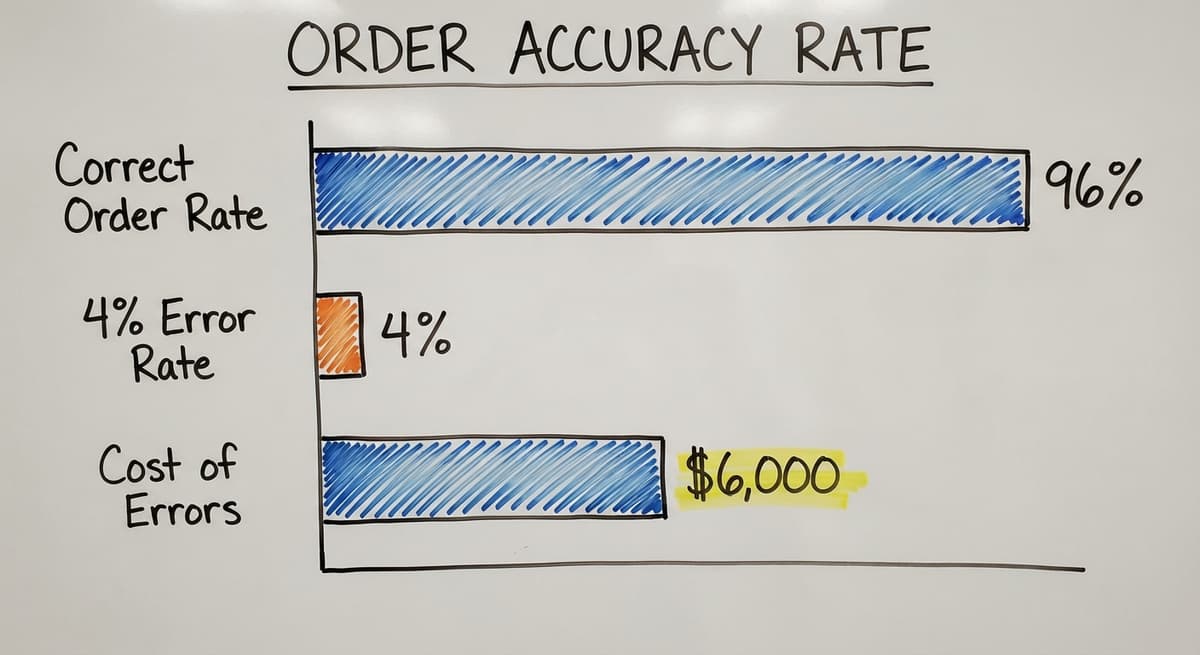
Order accuracy is the percentage of orders shipped correctly the first time. The formula: divide correct orders by total orders, then multiply by 100.
If your team ships 480 correct orders out of 500 total, your order accuracy rate is 96%. That sounds solid until you price the 4% error rate. At an average order value of $300, those 20 errors cost $6,000 in re-ships, returns, and staff time, before counting any damage to the customer relationship.
The IRS is direct about why accurate counts matter at the ledger level: "To figure taxable income, you must value your inventory at the beginning and end of each tax year," as stated in IRS Publication 538. Errors in picking and packing feed errors in valuation.
Tracking order accuracy shows exactly where the process breaks down, whether that is picking, packing, or data entry, so you can fix the right step.

Stockout Rate and Fill Rate
Stockout rate measures how often a requested item is unavailable when a customer orders it. Fill rate is the other side of that coin: the percentage of orders fulfilled from available stock without delay.
These 2 KPIs belong together. A low fill rate and a high stockout rate both point to the same root cause: purchasing is not keeping pace with demand. But they surface it from different angles. Stockout rate shows frequency. Fill rate shows scale.
The US FTC's Mail, Internet, or Telephone Order Merchandise Rule needs sellers to ship when promised or notify customers of delays. Frequent stockouts put that obligation at risk.
When sales data and the purchasing workflow are not connected, stockouts become routine rather than rare. Tracking both KPIs together shows whether that gap exists.
Days on Hand
Days on hand, sometimes called days inventory outstanding, tells you how many days of stock you currently hold based on your sales rate. The formula: divide Average Inventory by your daily Cost of Goods Sold.
If your daily cost of goods sold is $2,000 and your average inventory value is $60,000, you hold 30 days of stock. That number sets your reorder point. If your supplier takes 10 days to deliver, you need to reorder before you drop below 10 days on hand.
- Too many days on hand means cash is sitting in the warehouse instead of working.
- Too few days on hand means a delayed shipment from a supplier can cause a stockout.
The NIST Manufacturing Extension Partnership highlights days-on-hand as a core metric for supply chain process improvement. Getting this number right is how you set smarter reorder points without overstocking.
Carrying Cost of Inventory
Carrying cost is the total expense of holding inventory. It includes storage, insurance, spoilage, obsolescence, and the opportunity cost of capital tied up in stock. It is usually expressed as a percentage of total inventory value.

Most distributors underestimate this number. Storage rent appears in one line item. Insurance sits in another. Spoilage shows up as a write-off at year end. When those costs are spread across an accounting package, they are easy to miss as a combined burden.
A common industry range for carrying cost runs from 20% to 30% of inventory value per year. On $200,000 of average inventory, that is $40,000 to $60,000 per year just to hold the stock. That math changes how you think about reorder quantities and which SKUs are worth keeping.
The BLS reports that stock and order clerks earn a median wage near $20 per hour. Add 3 staff spending 5 hours a week on manual inventory counts and that is $15,600 a year in labor, before any carrying cost.
Knowing your carrying cost gives you the data to justify leaner reorder quantities and cut SKUs that cost more to hold than they earn.
See it running on your own process first
No build cost. The subscription starts once it is live and doing the job, not before.
Book a callHow to Start Tracking Inventory KPIs Without a Big ERP
Most small and mid-size distributors are not ready for a full ERP rollout. The good news is they do not need one to start tracking inventory KPIs.
The first step is finding where the data already lives. Orders sit in one system. Buy history sits in an accounting package. Receiving logs may be on paper or in a spreadsheet. None of those sources need to move. They need to connect.
Purpose-built working software that layers on top of an existing accounting package, rather than replacing it, is often the right fit at this scale. The goal is to automate data collection so KPIs update without someone pulling a report by hand each week.
Warehouse management for small and mid-size operations does not need a 12-month rollout. It needs a clear picture of which KPIs you are starting with, where the source data lives, and how the numbers will reach the person who acts on them. Start with 3 KPIs. Get those right before adding more.
Replacing spreadsheets and manual processes in distribution is achievable in stages, and the first stage is simply making the data you already have visible in one place.
How Do You Turn KPI Data Into Daily Decisions?
A KPI is only useful if the right person sees it at the right time. A monthly report that sits in an inbox does not drive decisions. A live dashboard an operations manager checks each morning does.
Inventory management software for wholesale distributors works best when it surfaces the numbers that matter to the person who acts on them, not every metric available. An ops manager needs to see fill rate, days on hand, and order accuracy. A buyer needs to see turnover by SKU and reorder alerts.
Custom working software that works with your accounting software can be built around how a specific operation already runs, rather than forcing the operation to conform to a generic system. That fit is what makes KPIs actionable rather than decorative.
When KPI data drives daily decisions, the whole operation becomes more predictable, and a more predictable operation is far easier to grow.
Ready to Connect Your Data?
If your inventory numbers live across an accounting package, spreadsheets, and order logs, the path forward starts with connecting those sources. A custom working system built around your workflow can surface the right KPIs to the right people every day, without replacing the tools your team already knows. Reach out to discuss what that looks like for your operation.
Frequently asked questions
What is 5 KPI?
There is no single official list called "the 5 KPIs." The phrase usually refers to picking 5 key performance indicators that cover the most important parts of an operation. For inventory management, a practical set of 5 would be inventory turnover, order accuracy rate, fill rate, days on hand, and carrying cost. The right 5 depend on what your operation needs to improve most.
What are some formulas used in inventory management?
The most common inventory formulas are: Inventory Turnover equals Cost of Goods Sold divided by Average Inventory; Days on Hand equals Average Inventory divided by daily Cost of Goods Sold; Order Accuracy Rate equals correct orders divided by total orders, multiplied by 100; Fill Rate equals orders fulfilled from stock divided by total orders requested, multiplied by 100; Carrying Cost is total holding expenses divided by average inventory value, expressed as a percentage.
How to measure KPI examples?
Measuring a KPI starts with identifying the data you need and where it lives. For order accuracy, you need a count of total orders shipped and a count of orders shipped without error. Divide one by the other and multiply by 100. For inventory turnover, pull your cost of goods sold from your accounting package and your average inventory value from your stock records. The key is pulling these numbers on a fixed schedule, weekly or monthly, so you can see trends rather than one-time snapshots.
What is a KPI for?
A KPI tells you whether a specific part of your operation is performing as expected. In inventory management, KPIs give you a factual basis for decisions about purchasing, staffing, and fulfillment. Without them, decisions rely on memory and gut feel, which leads to overstock, stockouts, and missed shipments. A KPI does not fix a problem on its own. It shows you where the problem is so the right person can act on it.
What is a good order accuracy rate for a fulfillment operation?
There is no universal benchmark that applies to every operation. Many fulfillment teams target 98% or higher. The more important number is your own baseline. Track your rate for 4 to 6 weeks, find your current average, and then set a target above it. An accuracy rate below 95% usually signals a process problem in picking, packing, or data entry that is worth investigating before setting a target.
What is the difference between stockout rate and fill rate?
Stockout rate measures how often a requested item is unavailable when a customer orders it. Fill rate measures the percentage of orders fulfilled from available stock without delay. Stockout rate shows frequency of the problem. Fill rate shows how well your purchasing and replenishment are keeping up with demand overall. Tracking both together gives you a fuller picture than either number alone.
How can a small distributor start tracking inventory KPIs without implementing a large ERP?
Start by identifying where your data already lives: your accounting package, your order logs, your spreadsheets. You do not need to replace any of those tools. Working software that connects to your existing accounting package can pull data from those sources and display KPIs automatically. Pick 3 KPIs to start, get consistent data flowing for those, and add more once the process is stable. A staged approach is faster and less disruptive than a full system replacement.
Start with a free first look
A 30 minute call, your operation mapped, and a clear picture of what we would build. No obligation and nothing to install.
Book a callRelated guides
The rest of this guide, for the parts of the job this page does not cover.
Guides
Common questions
- What is the Difference Between Aggregate and Item Inventory Management
- What is Jit Inventory Management
- What is Kanban System of Inventory Management
- What is the Definition of Inventory Management
- What is an Important Factor in Inventory Management
- What is Abc Classification in Inventory Management
- What is Inventory Management in Working Capital
- What is Inventory Management and Its Types
- What is the Main Purpose of Inventory Management
- What is Effective Inventory Management
- What is Information Technology Inventory Management
- What is Risk Pooling in Inventory Management
- What is Inventory Management Mary Kay
- What is Stock Taking in Inventory Management
- What is Bin Number in Inventory Management
- What is the Goal of Inventory Management Quizlet
- What is the Implication of Proper Inventory Management
- What is Omni-channel Inventory Management
- What is Inventory Management and Its Importance
- What is the Importance of Eoq in Inventory Management
- What is the Importance of Quality Inventory Management
- What is Inventory Management Explain Techniques of Inventory Management
- What is Mean by Inventory Management