


Inventory Management Photos
Inventory management photos show shelves, bins, scanning stations, software dashboards, and the staff who use them. A quick look at these images tells you whether a warehouse is running on a real system or on guesswork. This page walks through each type of photo and screenshot, explains what to look for, and helps you compare what you see in your own operation. Reviewed June 2025.
Book a callWhat Inventory Management Photos Actually Show
Inventory management photos capture 2 things: the physical space and the digital tools that track it. On the physical side, you see shelves, bins, pallets, receiving docks, and pick stations. On the digital side, you see software dashboards, scanner screens, and mobile apps. Together, these images document how an operation actually runs, not how the owner thinks it runs. A photo of a labeled bin next to a clean stock level screen tells a different story than a photo of sticky notes on a shelf next to a spreadsheet. Both stories are common. Knowing which one matches your warehouse is the first step toward fixing it.
We build it for your operation, and the first look is free
If you would rather not compare products, describe how your operation already works and we build the system around it.
No build cost. You see it running on your own process first, and the monthly subscription starts only once it is live.
Book a callWarehouse Shelving, Bin Labels, and SKU Tags in Photos
Well-organized shelving in warehouse inventory photos has a consistent look. Bins carry clear labels. Row spacing is even. Aisle markings are visible on the floor. Each label ties back to a SKU, which is a unique item code tracked in inventory software. As GS1 explains, barcode standards give every item a globally unique identity, so a scan at any point in the building returns the right record. You can read more at gs1.org/standards/barcodes. Cluttered shelves tell the opposite story: mixed items, missing labels, and no clear address for anything.
What Do Bin Labels and SKU Tags Look Like in Real Warehouse Photos?
Bin labels in working warehouses are printed, not handwritten, and they match the item codes in the inventory system. A barcode sticker sits below the label so a scanner can read it without a person typing anything. Consistent labeling is the physical foundation of any inventory system. Operations running on spreadsheets often have gaps: some bins labeled, some not, some with old SKUs that no longer match the software. Those gaps show up clearly in photos and they predict where count errors will appear.

Barcode Scanning in Inventory Management Photos
Barcode scanning photos show handheld scanners at 3 key points: the receiving dock, the pick station, and the shipping area. At receiving, a scan confirms what arrived and logs it at once. At picking, a scan confirms the right item left the right bin. At shipping, a scan closes the order and updates on-hand quantities. Whether a scanner feeds data in real time or in batches is visible in the software, not the photo itself, but the presence of scanners at all 3 points signals a real-time system. A warehouse where staff only scan at shipping is likely running batch updates, which means counts are wrong for most of the day.
Receiving Dock Photos and What They Reveal
What does a receiving dock look like when inventory management is working correctly? It has a clear staging area, inbound pallets in a defined zone, and staff confirming quantities against a buy order on a screen or tablet. Receiving is where most inventory errors start. A photo of a dock with pallets stacked randomly and a staff member holding a paper count sheet tells you that errors are being entered by hand and then typed again into a system later. Paper count sheets create 2 chances to write the wrong number. Digital receiving creates zero.
Paper Count Sheets Versus Digital Receiving
A photo of a staff member with a clipboard looks familiar. It is also a sign that the same numbers will be typed again later. Transcription errors from paper receiving ripple through every count that follows. A tablet or scanner at the dock removes that second entry step. Switching to digital receiving is often the first change a custom warehouse software build addresses, because it fixes the source of the problem rather than the symptoms downstream.
The comparison is easier when one option is built for you
Off-the-shelf means fitting your process to the software. We do it the other way round, and the first look costs nothing.
Book a call
Pick and Pack Station Photos
An efficient pick station has a clear flow: items arrive from the right location, the pick list names the bin address, and packing supplies are within reach. Photos of well-run pick stations show no searching, no guessing, and no wasted steps. Photos of struggling stations show the opposite: staff holding printed lists with handwritten corrections, supplies scattered, and no clear path through the work. Pick station layout directly affects both inventory accuracy and how fast orders leave the building. A system-driven pick list tells the picker exactly where to go. A paper list from yesterday does not.
Inventory Count and Cycle Count Photos
What does a cycle count look like on the warehouse floor? Staff count a small section of the warehouse, usually 1 aisle or 1 product category, while the rest of the operation keeps running. A full physical count shuts everything down. Cycle count photos show a quieter, more routine process: 1 or 2 people with scanners, working through a defined zone, logging counts as they go. The IRS is direct about why counting matters at all. IRS Publication 538 states: "To figure taxable income, you must value your inventory at the beginning and end of each tax year." Cycle counts spread that obligation across the year instead of compressing it into 1 painful week.
What Do Cycle Count Photos Tell You About How a System Is Working?
Frequent cycle count photos indicate a business that trusts its system enough to check it regularly. Operations that rely on Excel tend to avoid cycle counts because reconciling the results takes longer than the count itself. When counts happen often, reorder points stay accurate and dead stock gets caught early, before it blocks an aisle or ties up cash for months.

Inventory Management Software Dashboard Screenshots
What do inventory management software dashboards look like in screenshots? A working dashboard shows current stock levels, low-stock alerts, and reorder points for every item tracked. The data is live, not pulled from a spreadsheet updated the night before. A custom-built dashboard can show exactly the metrics a specific operation tracks, rather than the generic fields an off-the-shelf product decided were important.
Stock Level and Reorder Point Screens
A stock level screen lists each item by name, shows quantity on hand, displays the reorder point, and notes any quantity already on order. A visible reorder point means the system is watching the shelf, not a person checking a spreadsheet each morning. That single change removes the daily Excel check that many small distributors still rely on, and it removes the gaps that happen when that person is out sick.
Low Stock Alert and Notification Screenshots
A low-stock alert screenshot shows a flagged item, its current quantity, and a prompt to act. The alert can go to a dashboard, an email, or a mobile device, depending on how the system is set up. Automated alerts remove the need for someone to scan a spreadsheet looking for problems. The system finds the issue and surfaces it. The person decides what to do next.
See it running on your own process first
No build cost. The subscription starts once it is live and doing the job, not before.
Book a callQuickBooks Integration Screenshots in Inventory Workflows
How does inventory software connect to QuickBooks and what does that look like? A screenshot of a connected system shows buy orders, cost of goods sold, and inventory asset values flowing into QuickBooks without manual entry. Many small distributors already use QuickBooks and do not want to replace it. A custom inventory system can push data to QuickBooks directly, updating the books as transactions happen. That means no double entry, no end-of-month matching scramble, and no need to migrate to a full ERP. The QuickBooks integration for wholesale operations sits between the warehouse floor and the accounting file, keeping both current.

Purchase Orders, Vendor Receipts, and Dead Stock Photos
A buy order screen in inventory software shows the vendor name, items ordered, quantities, and expected delivery date. A vendor receipt screen confirms what actually arrived and flags any gap between the order and the delivery. Together, these 2 screens close the loop on receiving accuracy without a phone call or an emailed spreadsheet.
Dead stock shows up in warehouse photos as pallets blocking aisles, shelves packed past capacity, and items with a visible layer of dust. Dead stock in photos is a sign that reorder points are set too high or that demand is not being tracked at all. The US Census Bureau tracks the inventories-to-sales ratio for wholesale firms at census.gov/wholesale, and a rising ratio is the macro version of what dead stock photos show at the individual warehouse level: more inventory than the business is moving. Tied-up capital and wasted storage space are the financial cost.
Before and After Inventory Organization Photos
Before-and-after inventory organization photos show cluttered, unlabeled shelves becoming organized, labeled, and system-tracked. The physical change is real, but it reflects a process change, not a cleaning day. A warehouse that reorganizes without changing the system will look the same in 6 months. Lasting organization needs a system that enforces location and label standards every time an item moves. The before photo shows what happens without that enforcement. The after photo shows what sticks when the system does the work.
Mobile Inventory App Screenshots and Shipping Station Photos
A mobile inventory app on a phone or tablet shows item lookup, scan-to-receive, and pick list navigation on a single screen. Staff can update inventory on the floor without walking back to a desktop. A custom mobile interface can match the exact steps a team already follows, which cuts training time to near zero.
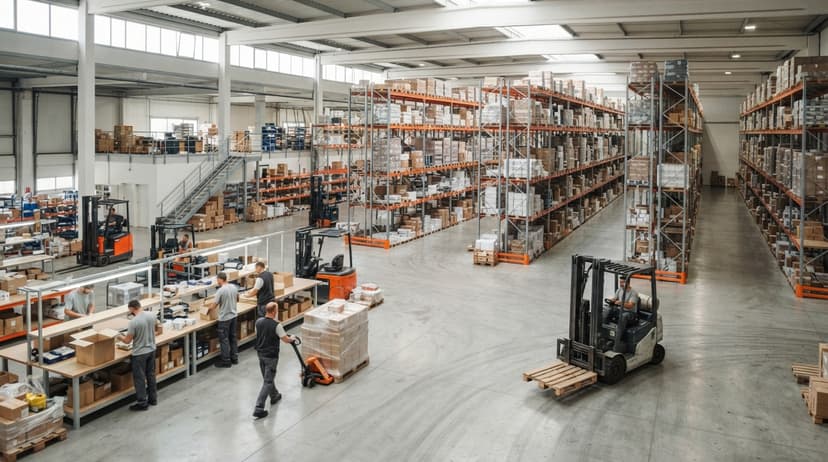
At the shipping station, a well-run operation shows packed boxes, a label printer, a packing slip, and a scan confirmation before anything leaves. That final scan closes the inventory loop and updates on-hand quantities automatically. A shipping station without a scan step is a station where inventory records lag behind reality.
Not sure this is the right shape for your operation
Describe how the work runs today. We map it on a call and show you what it would look like built around that, before you spend anything.
Book a callReporting and Analytics Screenshots
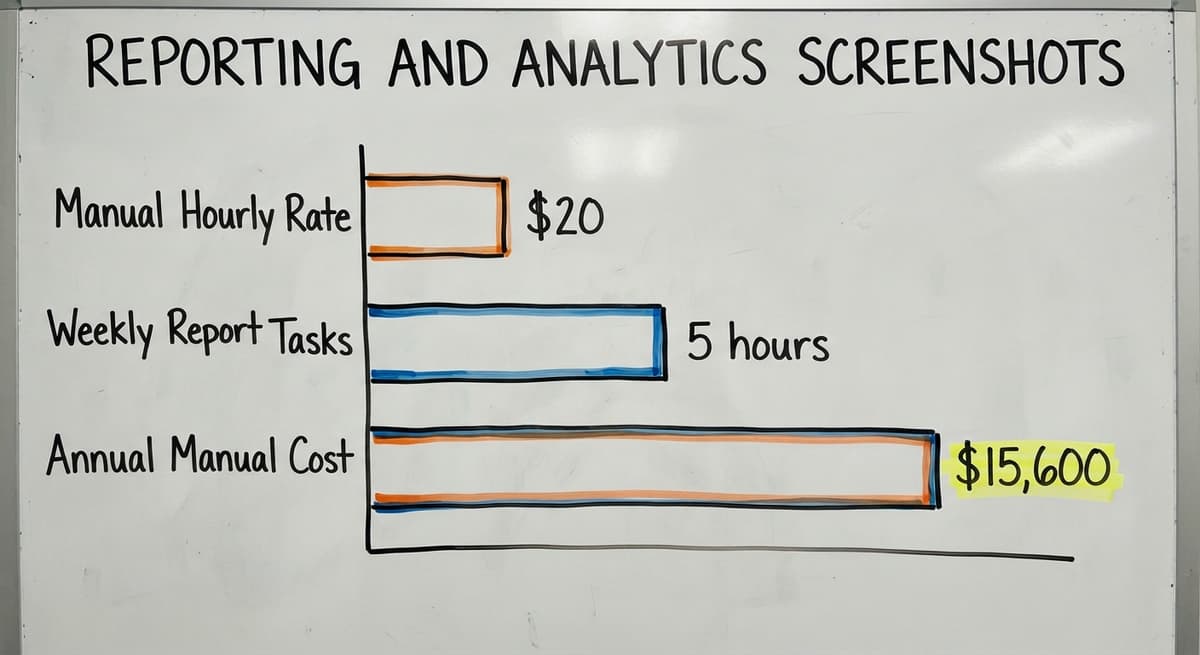
Inventory reporting screens show turnover rates, days on hand, top-moving SKUs, and slow movers. These are the numbers that drive buying decisions. A custom report matches exactly what the business already tracks, rather than forcing a new framework onto an existing operation. Staff who handle this work manually earn around $20 per hour according to the US Bureau of Labor Statistics. Three people spending 5 hours a week pulling and checking reports is $15,600 a year. A reporting screen that updates itself costs a fraction of that and removes the lag between the data and the decision.

What Good Inventory Management Looks Like for Small Distributors
Good inventory management photos from a small distributor look different from large warehouse photos. The team is smaller, the space is tighter, and there are no conveyor systems. A 10-person operation does not need enterprise software to have clean, accurate, system-driven inventory. The principles visible in any good photo, labeled locations, real-time counts, automated alerts, apply at any scale. The NIST Manufacturing Extension Partnership offers vendor-neutral supply chain guidance that applies to small operations as well as large ones. Small does not mean manual. It means the system needs to fit the team, not the other way around.
What Do Photos Tell You About Whether an Inventory System Is Working or Struggling?
Visible signs of a working system include consistent bin labels, clear aisle markings, staff using scanners at multiple points, and screens showing current data. Signs of a struggling system are just as visible: paper everywhere, unlabeled bins, staff counting by hand with no record, and multiple spreadsheets open at once. Sticky notes on shelves, staff waiting for a count to finish before shipping, and a desktop covered in open tabs are not permanent conditions. They are the parts of the operation that a custom system built around the existing workflow can replace without tearing out what already works.
How Custom Inventory Software Changes What Your Operation Looks Like
A custom-built inventory system changes the physical appearance of an operation over time. Fewer papers appear at the dock. Stations get cleaner because staff are not managing workarounds. Receiving gets faster because the system confirms the count. The custom warehouse software for small distributors approach builds around how the team already works, so the shift does not need retraining everyone from scratch. The visual improvements, cleaner stations, faster receiving, accurate labels, connect directly to business outcomes: fewer stockouts, faster fulfillment, and QuickBooks data that matches the warehouse floor without a monthly matching fight.
If the photos in this article look like your operation, the next step is a conversation about which parts of the system to replace first. The goal is not a full overhaul. It is fixing the specific spots that are causing the most pain, starting with the ones that show up in photos.
Frequently asked questions
What does a well-organized warehouse look like in inventory management photos?
Organized warehouses show printed bin labels that match SKU codes in the inventory system, even aisle spacing, floor markings, and staff using scanners rather than paper lists. Every item has a fixed address and the system knows where it is.
What do inventory management software dashboards look like in screenshots?
A working dashboard shows live stock levels, reorder points, and low-stock alerts for every tracked item. The data reflects what is on the shelf right now, not what was entered into a spreadsheet last night.
What does barcode scanning look like in a real warehouse operation?
Scanners appear at 3 points: the receiving dock, the pick station, and the shipping area. Each scan logs a transaction at once. If scanners only appear at shipping, the counts are likely wrong for most of the day.
What does a receiving dock look like when inventory management is working correctly?
A controlled receiving dock has a defined staging area, inbound pallets in one zone, and staff confirming quantities against a digital buy order. There are no paper count sheets and no second entry step.
What are the visible signs in photos that an inventory system is struggling?
Sticky notes on shelves, unlabeled bins, paper count sheets at the dock, multiple spreadsheets open on a desktop, and staff waiting for a count to finish before shipping are all visible signs of a system that is not keeping up with the operation.
How do before-and-after inventory organization photos show system improvement?
The before photo shows cluttered, unlabeled shelves. The after photo shows labeled bins, clear aisles, and a system tracking every location. The difference is not a cleaning effort. It is a process change enforced by software every time an item moves.
How does inventory software connect to QuickBooks and what does that look like?
A connected system pushes buy orders, cost of goods sold, and inventory asset values into QuickBooks as transactions happen. The screenshot shows matching numbers in both systems without anyone typing the same figure twice.
What does good inventory management look like for a small distributor with 5 to 100 staff?
The photos look like a larger warehouse at smaller scale: labeled bins, scanners in use, a live dashboard, and a receiving dock with a digital confirmation step. The system fits the team size and does not need enterprise software or a full ERP.
Start with a free first look
A 30 minute call, your operation mapped, and a clear picture of what we would build. No obligation and nothing to install.
Book a callRelated guides
The rest of this guide, for the parts of the job this page does not cover.
Guides
- Multi Location Inventory Management Software
- Inventory Management for Multiple Locations
- Inventory Management System for Manufacturing
- Jewelry Inventory Management
- Dental Inventory Management
- Qr Code for Inventory Management
- Hvac Inventory Management Software
- Inventory Management Software for Schools
- Nonprofit Inventory Management
- Manual Inventory Management
- Inventory Management Software Costs
- Hvac Inventory Management
- Warehouse Inventory Management Software
- Warehouse Inventory Management Systems
- Quickbooks Inventory Management Software
- Inventory and Warehouse Management Software
- Custom Inventory Management Software
- Warehouse Inventory Management System
- Retail Inventory Management
- Manufacturing Inventory Management Software